Mapping lived experience in school buildings (with special attention to the diagram in architecture)
Laura Trafí-Prats, project PI and Senior Lecturer at the Faculty of Health and Education at Manchester Metropolitan University
This new blog entry grapples with one of the research questions that our study has been occupied with: How is it possible to visualize and map the diffuse, ephemeral and affective atmosphere of school buildings to enhance our understanding of school life?
It does it with an attention to historical and current engagements with mapping and visualizing in architecture, and with a concern for their disconnect from other fields, including cartography, urban planning, conceptual art, science. The concept of the diagram is central to how all these bespoken fields articulate knowledge visually. However, as Garcia (2010) and Dortdivaniloglu (2018) have noted, these many uses have generated contradictory and dispersed understandings. Additionally, diagrammatic practices could be highly specialised and grounded on discipline-based techniques, graphic conventions, technologies, and habits of knowledge that seem to address specific visualising subjects and remain obscure and inaccessible to others (Ducker, 2021). As such, we suggest that a closer attention to diagrammatic thought and practice can help ascertaining interdisciplinary possibilities in mapping and visualisation with potential to knit connections between eco-sensory approaches to experience, design processes and school architectures, as our research question envisions. We operate with a non-modernist definition of design, conceiving design as a process, not exclusive to the professional designer, that begs the existential question of how we compose, fold, ensemble more than human worlds capable of sustaining diverse and inclusive forms of life (Latour, 2008).
In this manner, the blog presents a brief review of what is a diagram, its possibilities, and critiques. We bring some of these ideas to critically consider some of the diagrams created by BDP to devise and communicate the design of the school that occupies this study. Following this, we move the focus on thinking with diagrammatic philosophies and practices that hold together in tension the inscriptive (visualization) and the processual (affective) aspects of experience invoked in our research question (see also, Dortdivaniloglu, 2018). We end by examining two examples on how our study has connected with aspects of diagramming theory with focus on two theories and how they have informed two of the kinds of mappings that we are generating in the project. The first theory is known as mapping controversies in architecture (Yaneva, 2012, 2022). It is informed by STS ethnographies of buildings of science initiated by Latour. One of its central assumptions is that design is not the product of an architect’s mind, but emerges from the thinking, acting and responding to emerging issues of different human and non-human actors. Thus, to understand what makes the design of a specific school building unique emerges from the tracing, connecting and mapping of these controversies that vary and change at different moments of the building’s life. The second theory draws on posthuman notions of design and ecological thinking to produce alternative descriptions of the Earth from the ground and through living maps. Aït-Touati, Arènes and Gregòire (2022) propose, that a living map engages with “the thickness of the ground” (p. 9) to offer a provisional image of “a resonant milieu, composed of thousands of superimpositions and actions of the beings that surround us, constantly and indefinitely produced by the movements and perceptions of those who create it” (p. 12).
The diagram in architecture
As Garcia (2010) has suggested “diagrams in architecture are as old as architecture itself” (p. 18). Since Vitruvius the diagram has been an exemplary genre for how architecture applies knowledge from other disciplines and domains (physics, astrology, optics, acoustics, geometry, meteorology, mechanics, colour and so on) into communicating design ideas and processes. However, due to architecture being a field that has privileged visualisation over text, and publications in catalogues and magazines over more conventional academic formats, the concept of the diagram is dispersed and embedded in texts dedicated to other concerns, with just few books giving it attention at the theoretical level (e.g. Clark & Pause, 2005; Ferrater & OAB, 2006; Garcia, 2010).
Viedler (2010) connects the establishment of diagrammatic practices in architecture to the Modernist movement, and more specifically to its coupling of abstraction with functionalism. This made architectural diagramming a practice of visualization aimed to organise functions such as movement, event, space, time, light, flow, thereby escaping from the entrapment of architectural drawing in the representational conventions of the plan and its tights to scale, measure, and the object’s identity. Complementary, Aureli (2005) sees the emergence of diagrammatic representation in architecture in connection to a growing awareness of the embeddedness of buildings in the fabric of urban space. In addition, he associates it to “the advent of cartography in the course of the 17th and 18th centuries and of electromagnetism in the early 19th “ (p. 5). To him, these events materialize a different sense of space “through the representation and creation of a web of spatial transaction: networks and flows” (p-6).
Across the 20th and 21st centuries the diagram is instituted as a powerful device for architecture, design and urban planning, but this is not without its problems and critiques. While the ideographic, and synthetic nature of the diagram makes the exposition of ideas easy and effective, this same aspect makes it suspicious of delivering pictures of the world with an excess of style that can “camouflage reality” (Aureli, 2005, p. 5). Echoing this, prestigious space scholars like Lefebvre (1991), have interrogated modern urban design for its obsession on graphic representation, seeing it as a fetishization of the real, and a central cause in the sterilisation and degradation of lived space.
Possibly, the critiques to the diagram and its association with Modernism and rigid modes of formalism have gathered more attention than its intrinsic potential. Such potential has not escaped contemporary architects like Hadid, Eisenmann, Liebeskin, Sejima, Koolhas and others, who have critically extended its uses in different directions. For instance, Eisenman approaches the diagram machinically, as a generator of architectural design. Influenced by the philosophies of Deleuze and Derrida, for Eisenmann the diagram “consists of multiple levels that allow infinite possibilities to write and re-write on the top surface while it keeps the previous traces on the bottom layer” (Dortdivaniloglu, 2018, p. 6). The diagram’s organizing forces are traced and multiply connected, but also regenerated and reconverted from one layer to another, endowing the design process with generative capacity and keeping it dynamic and open.
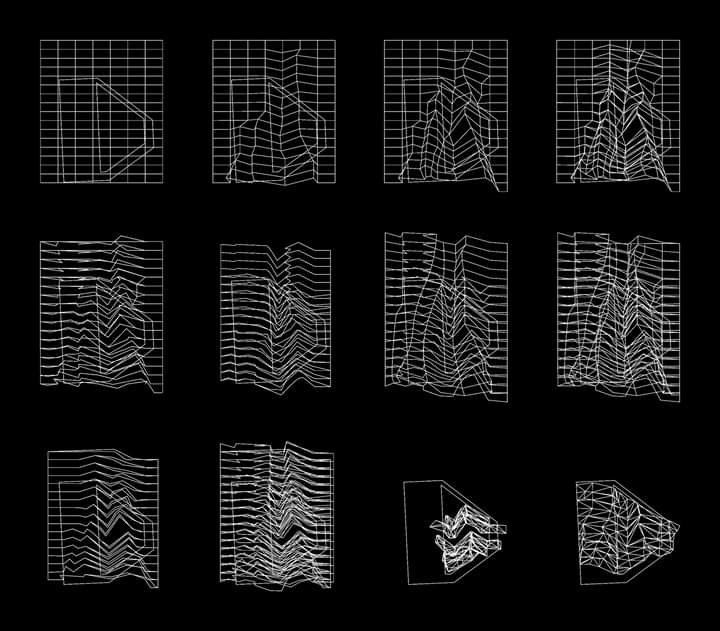
Peter Eisenmann, Church, 1996 [diagramming]
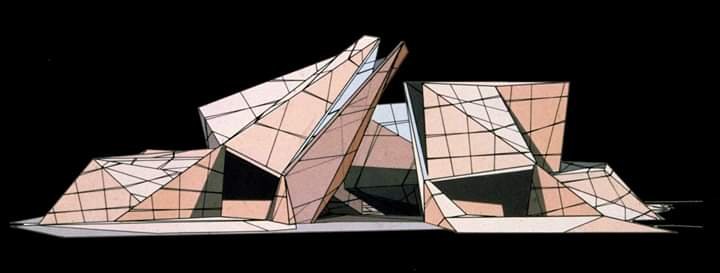
Peter Eisenmann, Church, 1996 [model]
Diagrams in the Design of Our School Building
Clearly, one of the inescapable potentials of the architectural diagram is its simplicity and economy of means, which makes building design communicable to its potential users. At the same time, diagrams can “simplify and idealise facts and events of the world [and make them pass] as simple signs” (Aureli, 2005, p. 5). In our project, we witnessed this contradictory nature of the diagram in the plans and drawings that the firm BDP produced of the school building. Some diagrams appeared as compositions of few abstract volumes, where two brackets stand for the 3-ring elevation and two cuboidal shapes for the volumes of theatre and the specializations as a synthesis of a “legible building”. In another diagram a cute red heart is placed in the middle of the the two brackets, expressing one of the mottos of Building Schools for the Future (BSF), which was designing schools with a heart. Other diagrams are more detailed and technical, deploying elevations, cross-cuts, blueprints visualisations of the building also consistent with BSF’s educational vision, featuring flexible and open spaces, plenty of natural light, cohesive spatialisation of the curriculum in learning houses, corners that enhanced flow, etc.

School diagrams, BDP
Many of the school diagrams provided by BDP were created with modelling and rendering software. Some scholars express concern on how the current use of such technologies in processes of design contributes to standardization and the consequent reduction of the generative and speculative powers of the diagram. Viedler (2010) writes that such design practices seem “less driven by the polemical belief in the virtues of abstract representation of a new world than by the limits of software’s replication of surface, colour texture and its notorious aversion to any ambiguity” (p. 62). This is an assessment that resonates with a particular diagram that featured the access to the school building through an animation. The moving images deploy an unrestrained sense of flow while trace a gracious curve along the theatre volume leading to the open and luminous atrium space. It is a rendering that possibly aimed to symbolize the experience of entering the school foreseen by BSF design philosophy as accessing “a civic ground [that] encourage[d] those who go inside to rise to their occasion, whether as participants or observers” (Power, 2003, p. 266). At the same time, the diagram seems a pure exercise in formalism, that as Viedler (2010) remarked, expresses the limits of the software in presenting light and surfaces that hardly resemble the actual conditions of dwelling in such space. Its smoothness and clarity seem to favour mastering over experimenting with the potential of the abstract form to be generative, processual, and an expression of multiplicity.
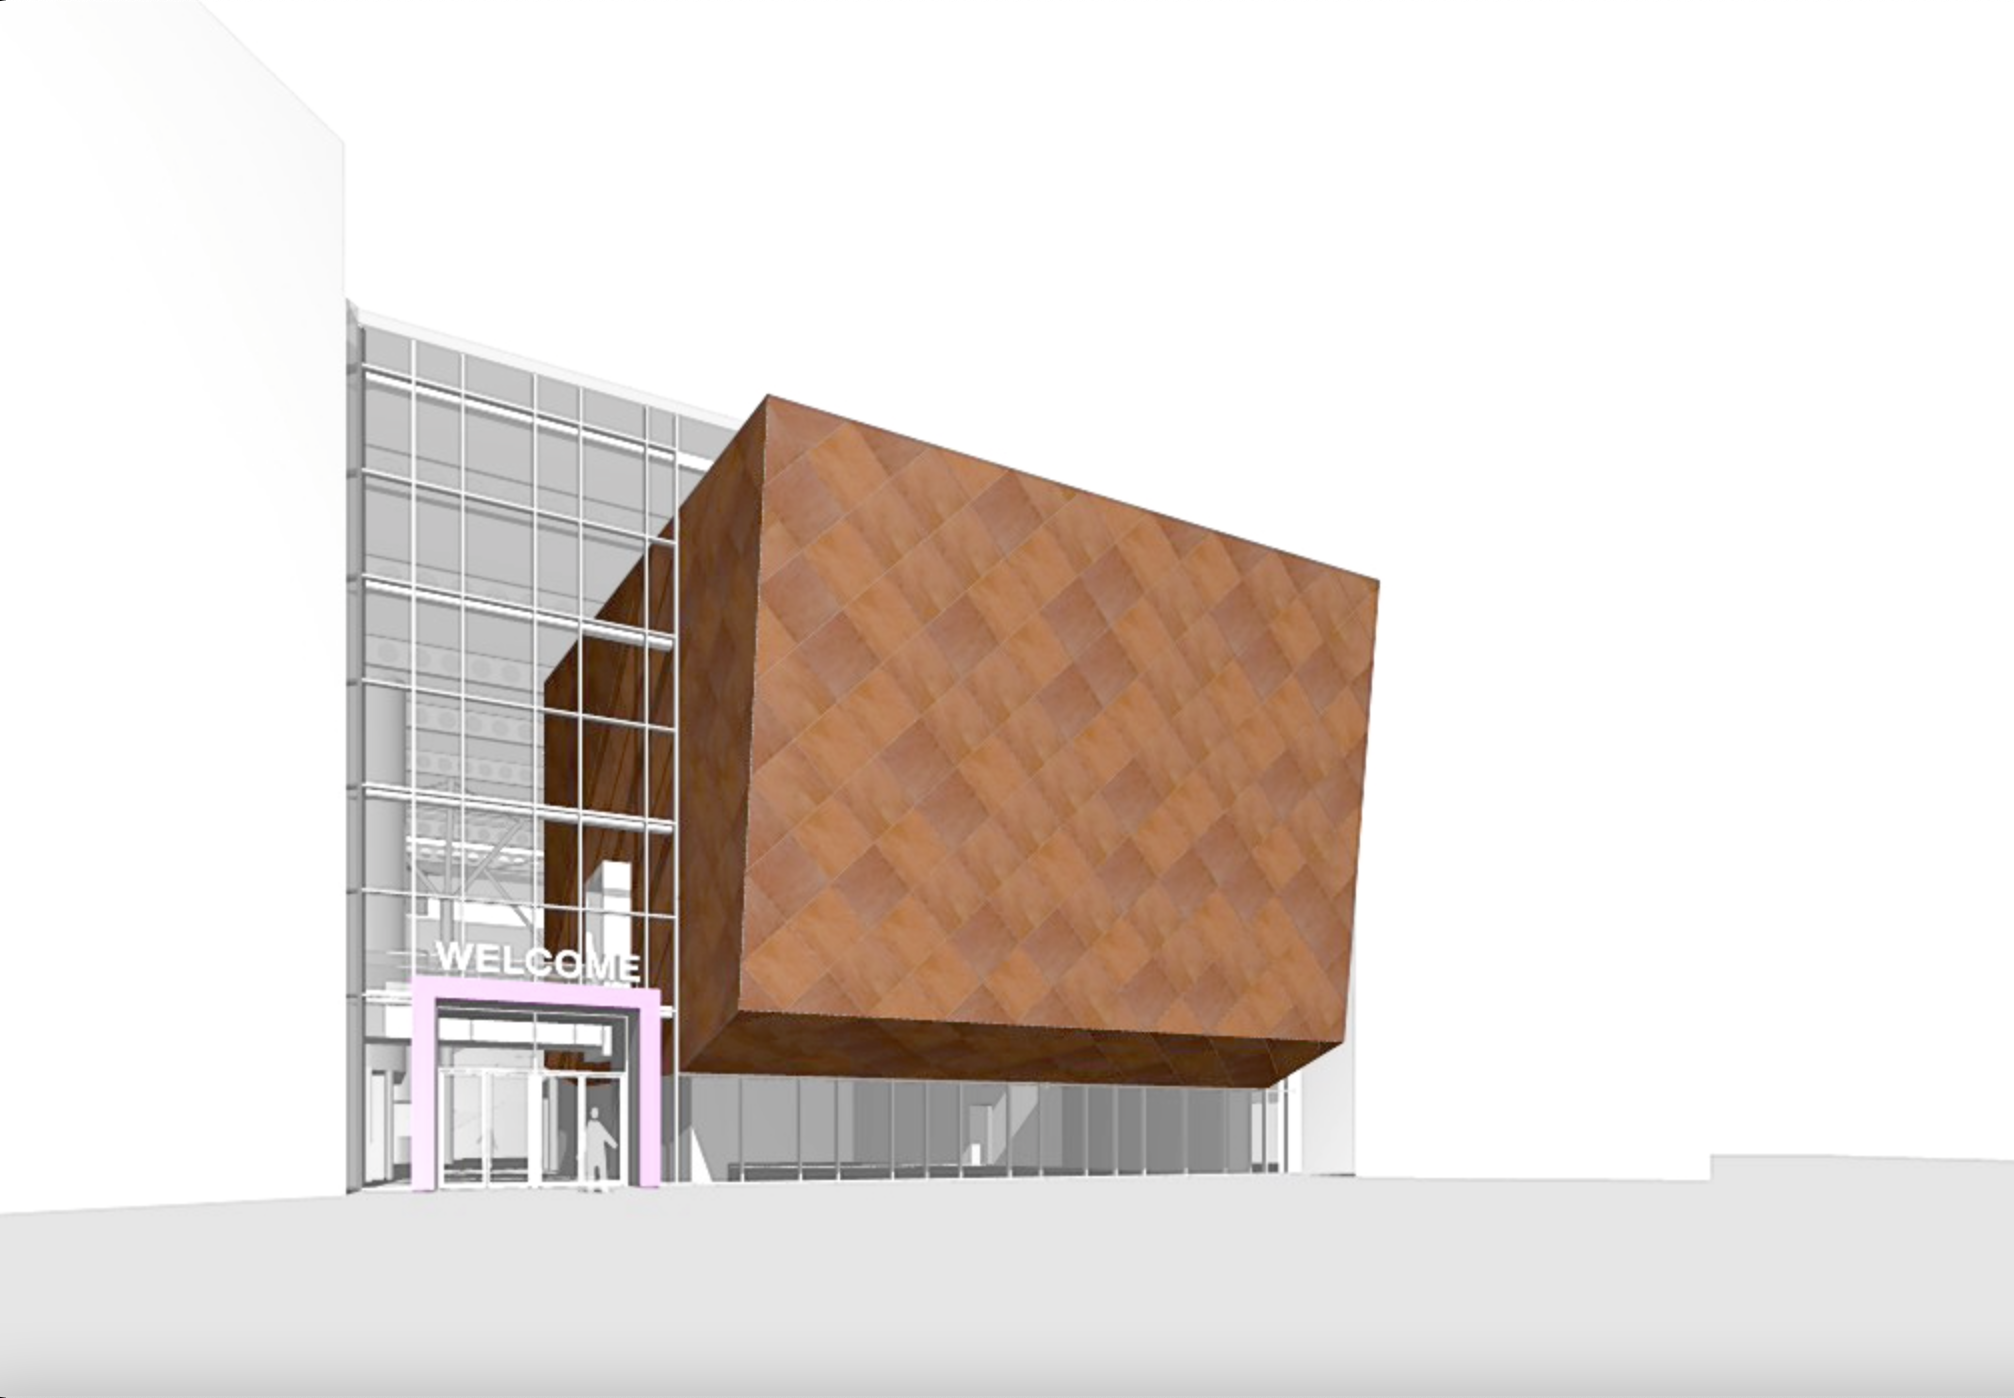
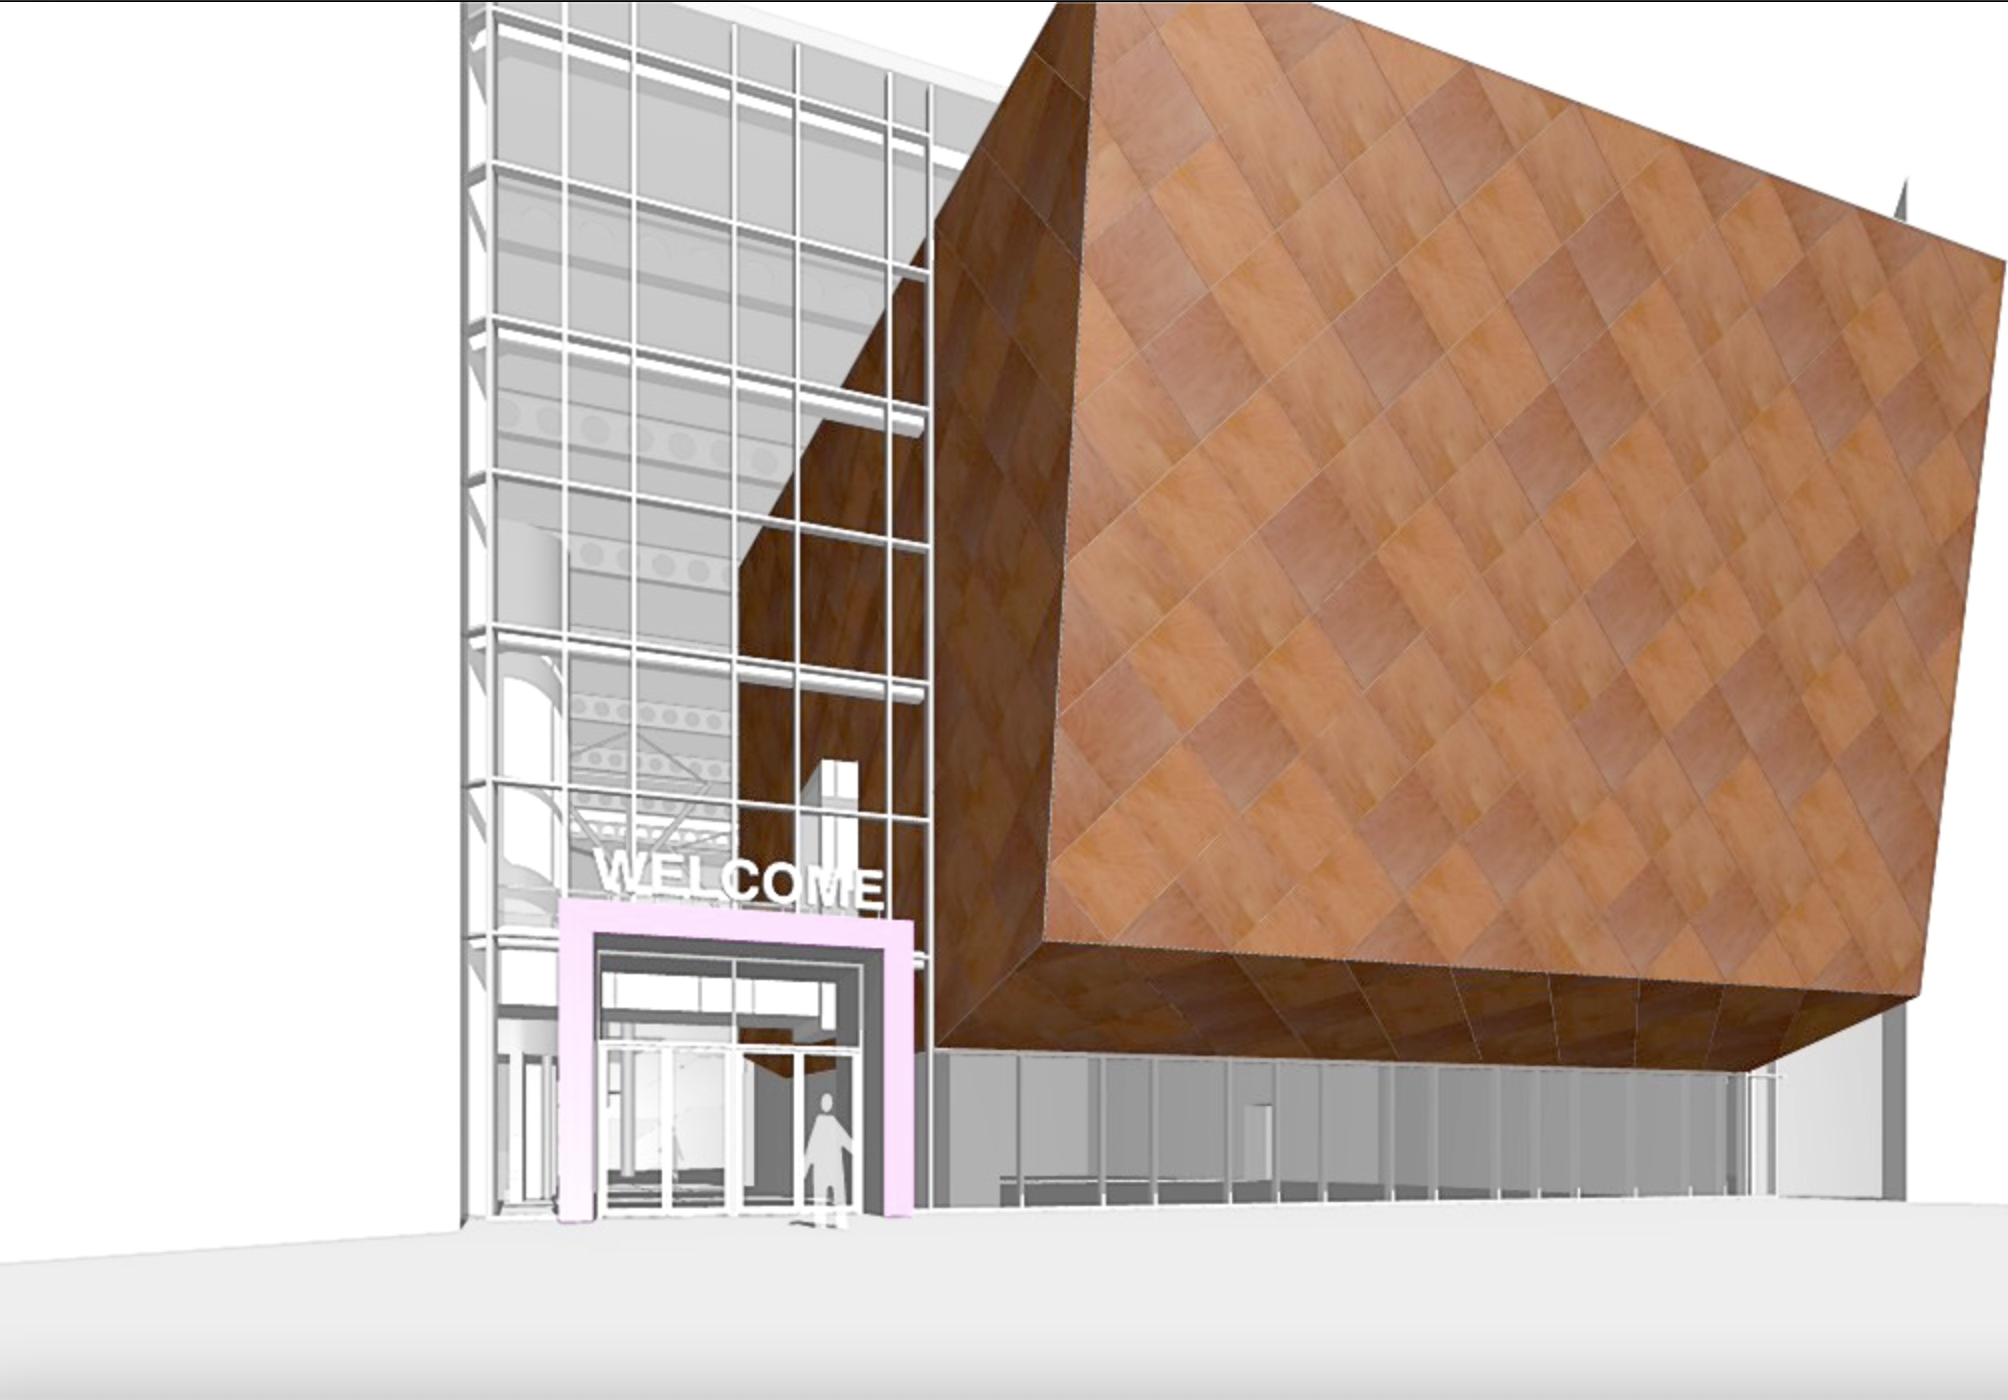
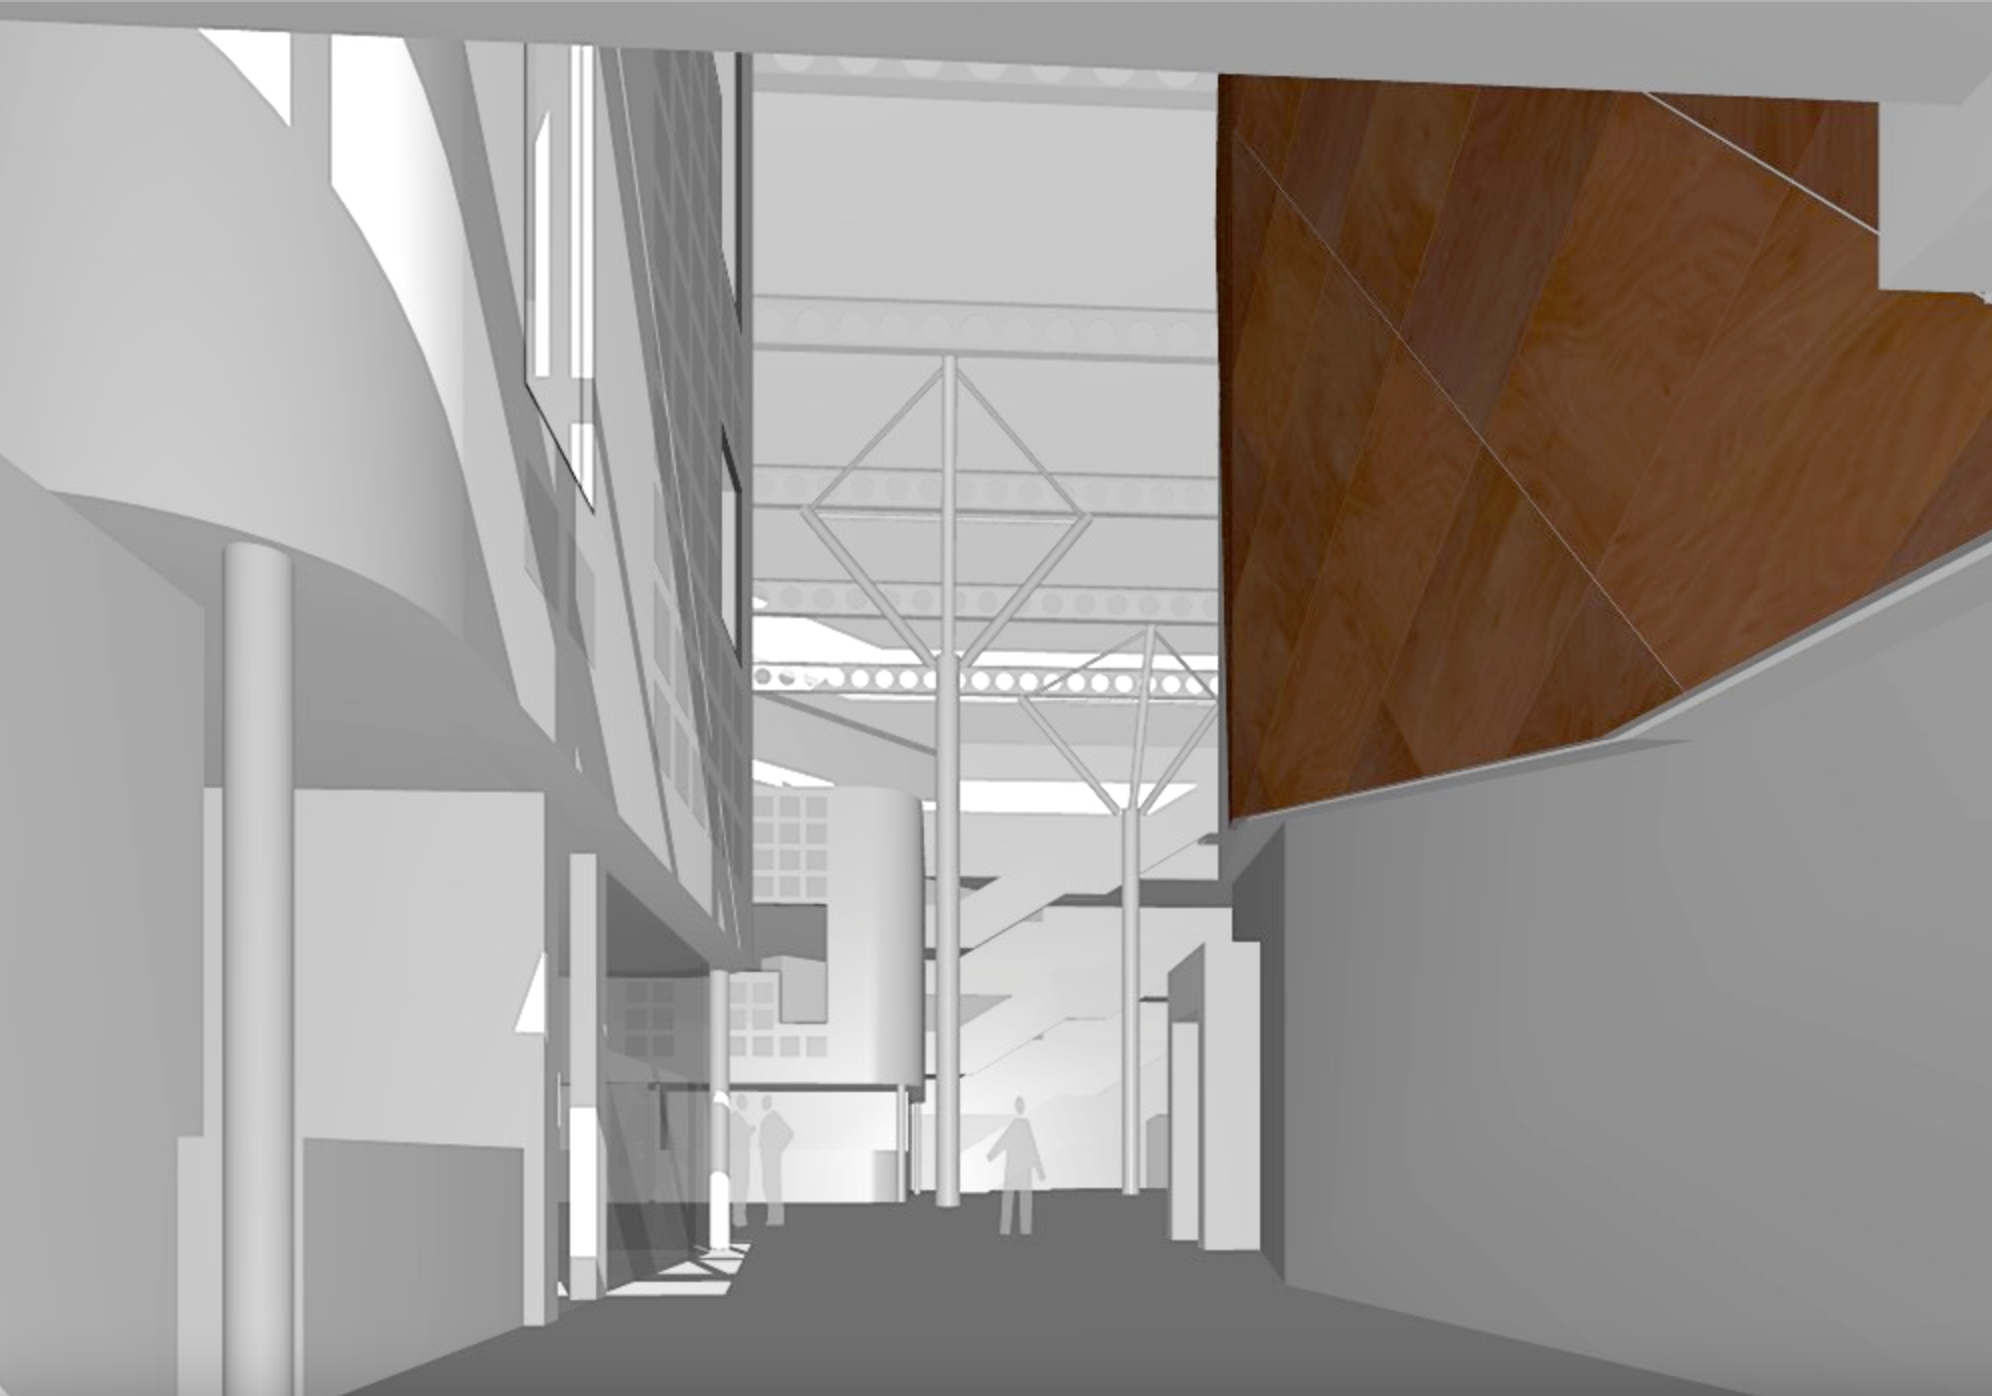
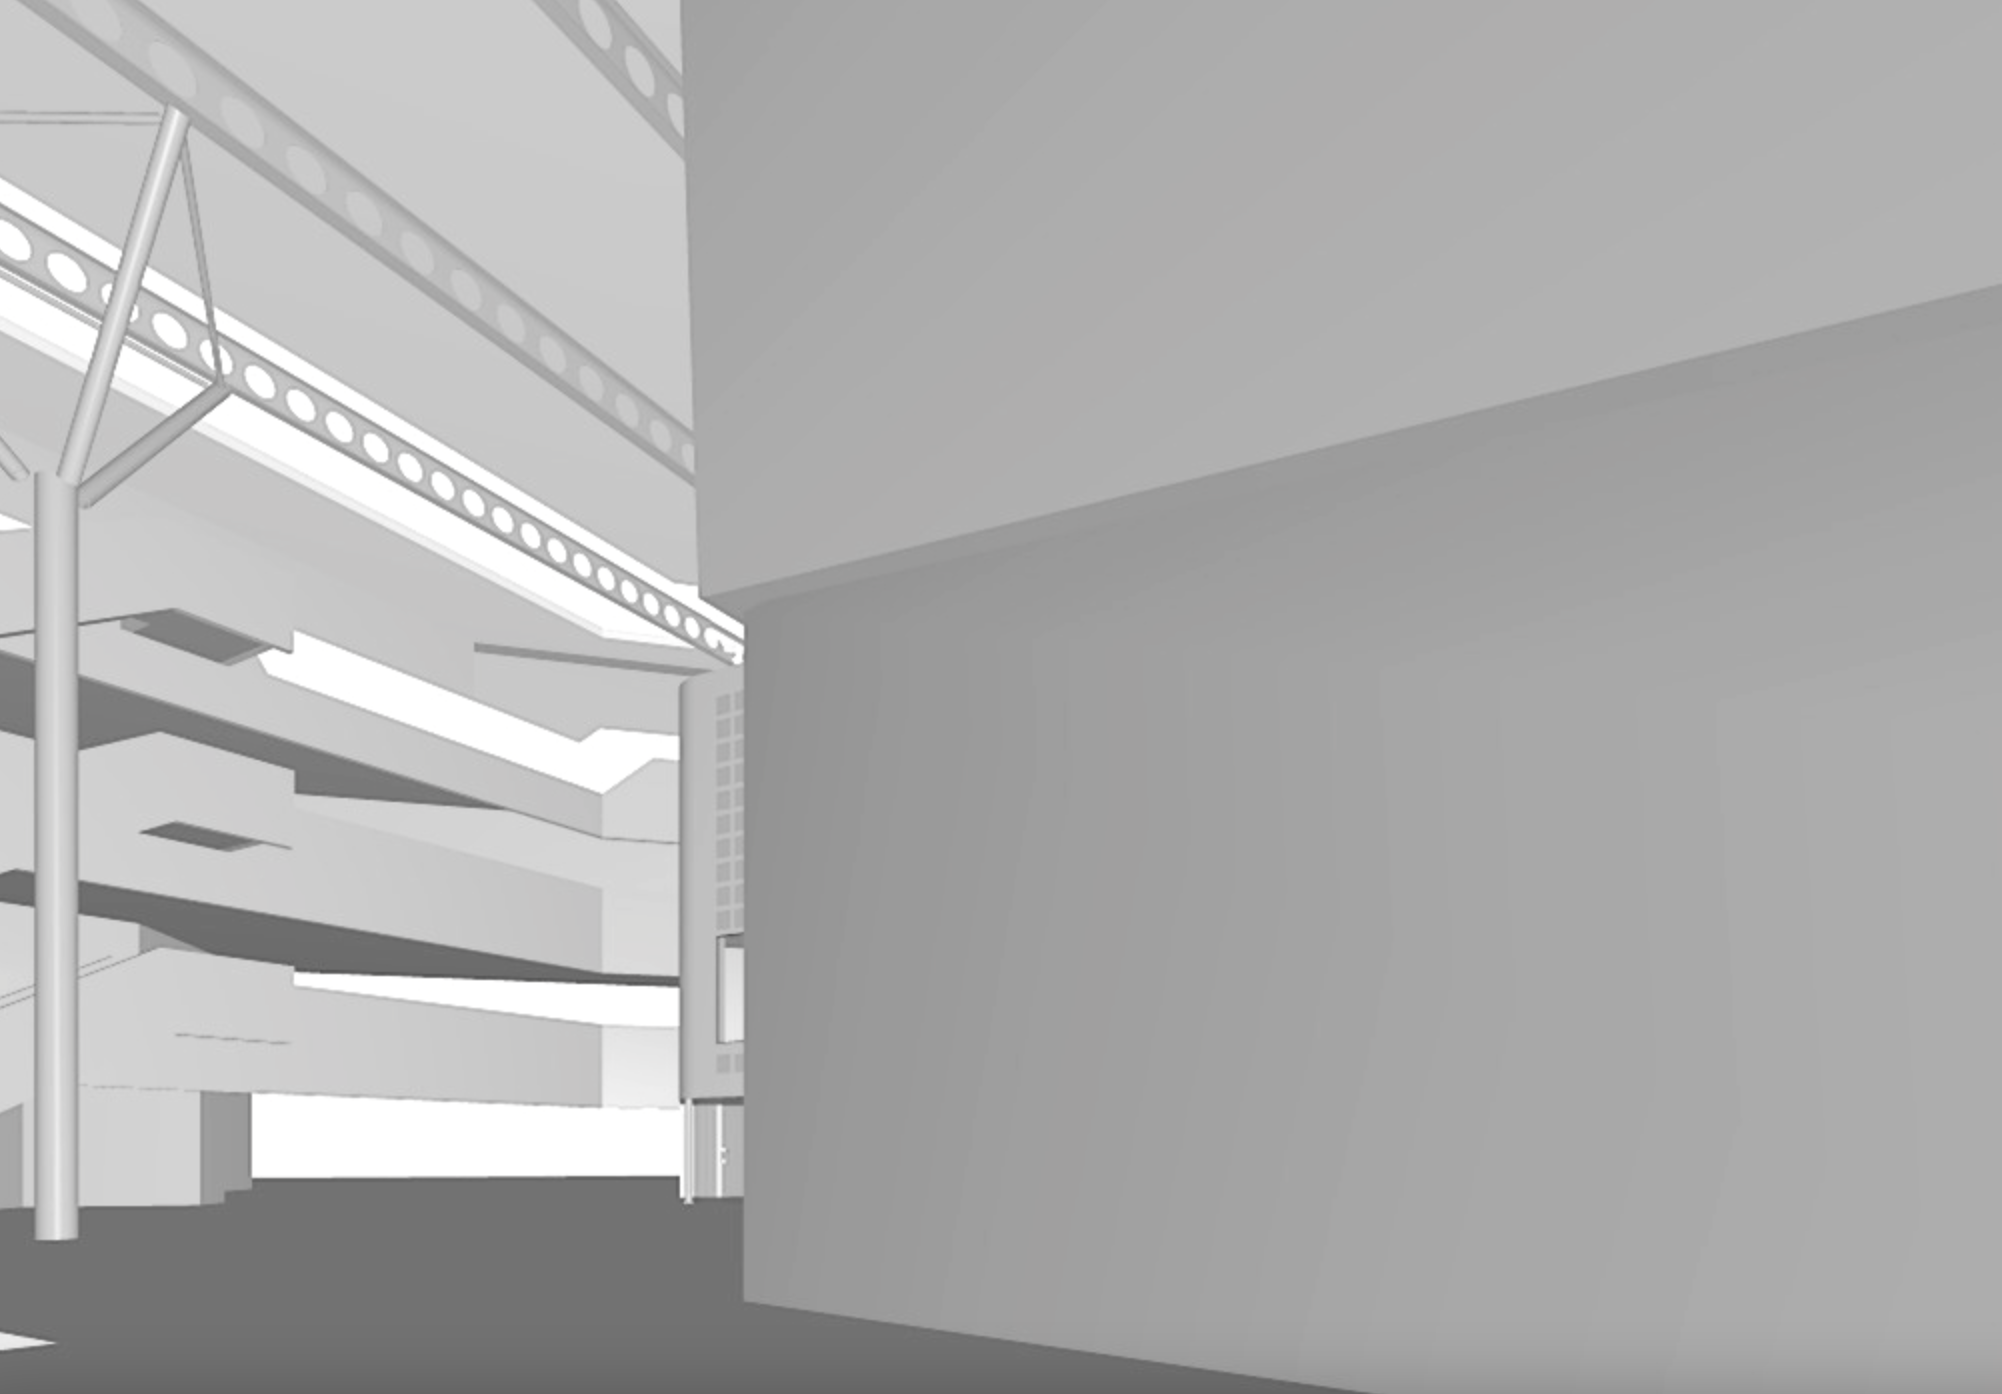
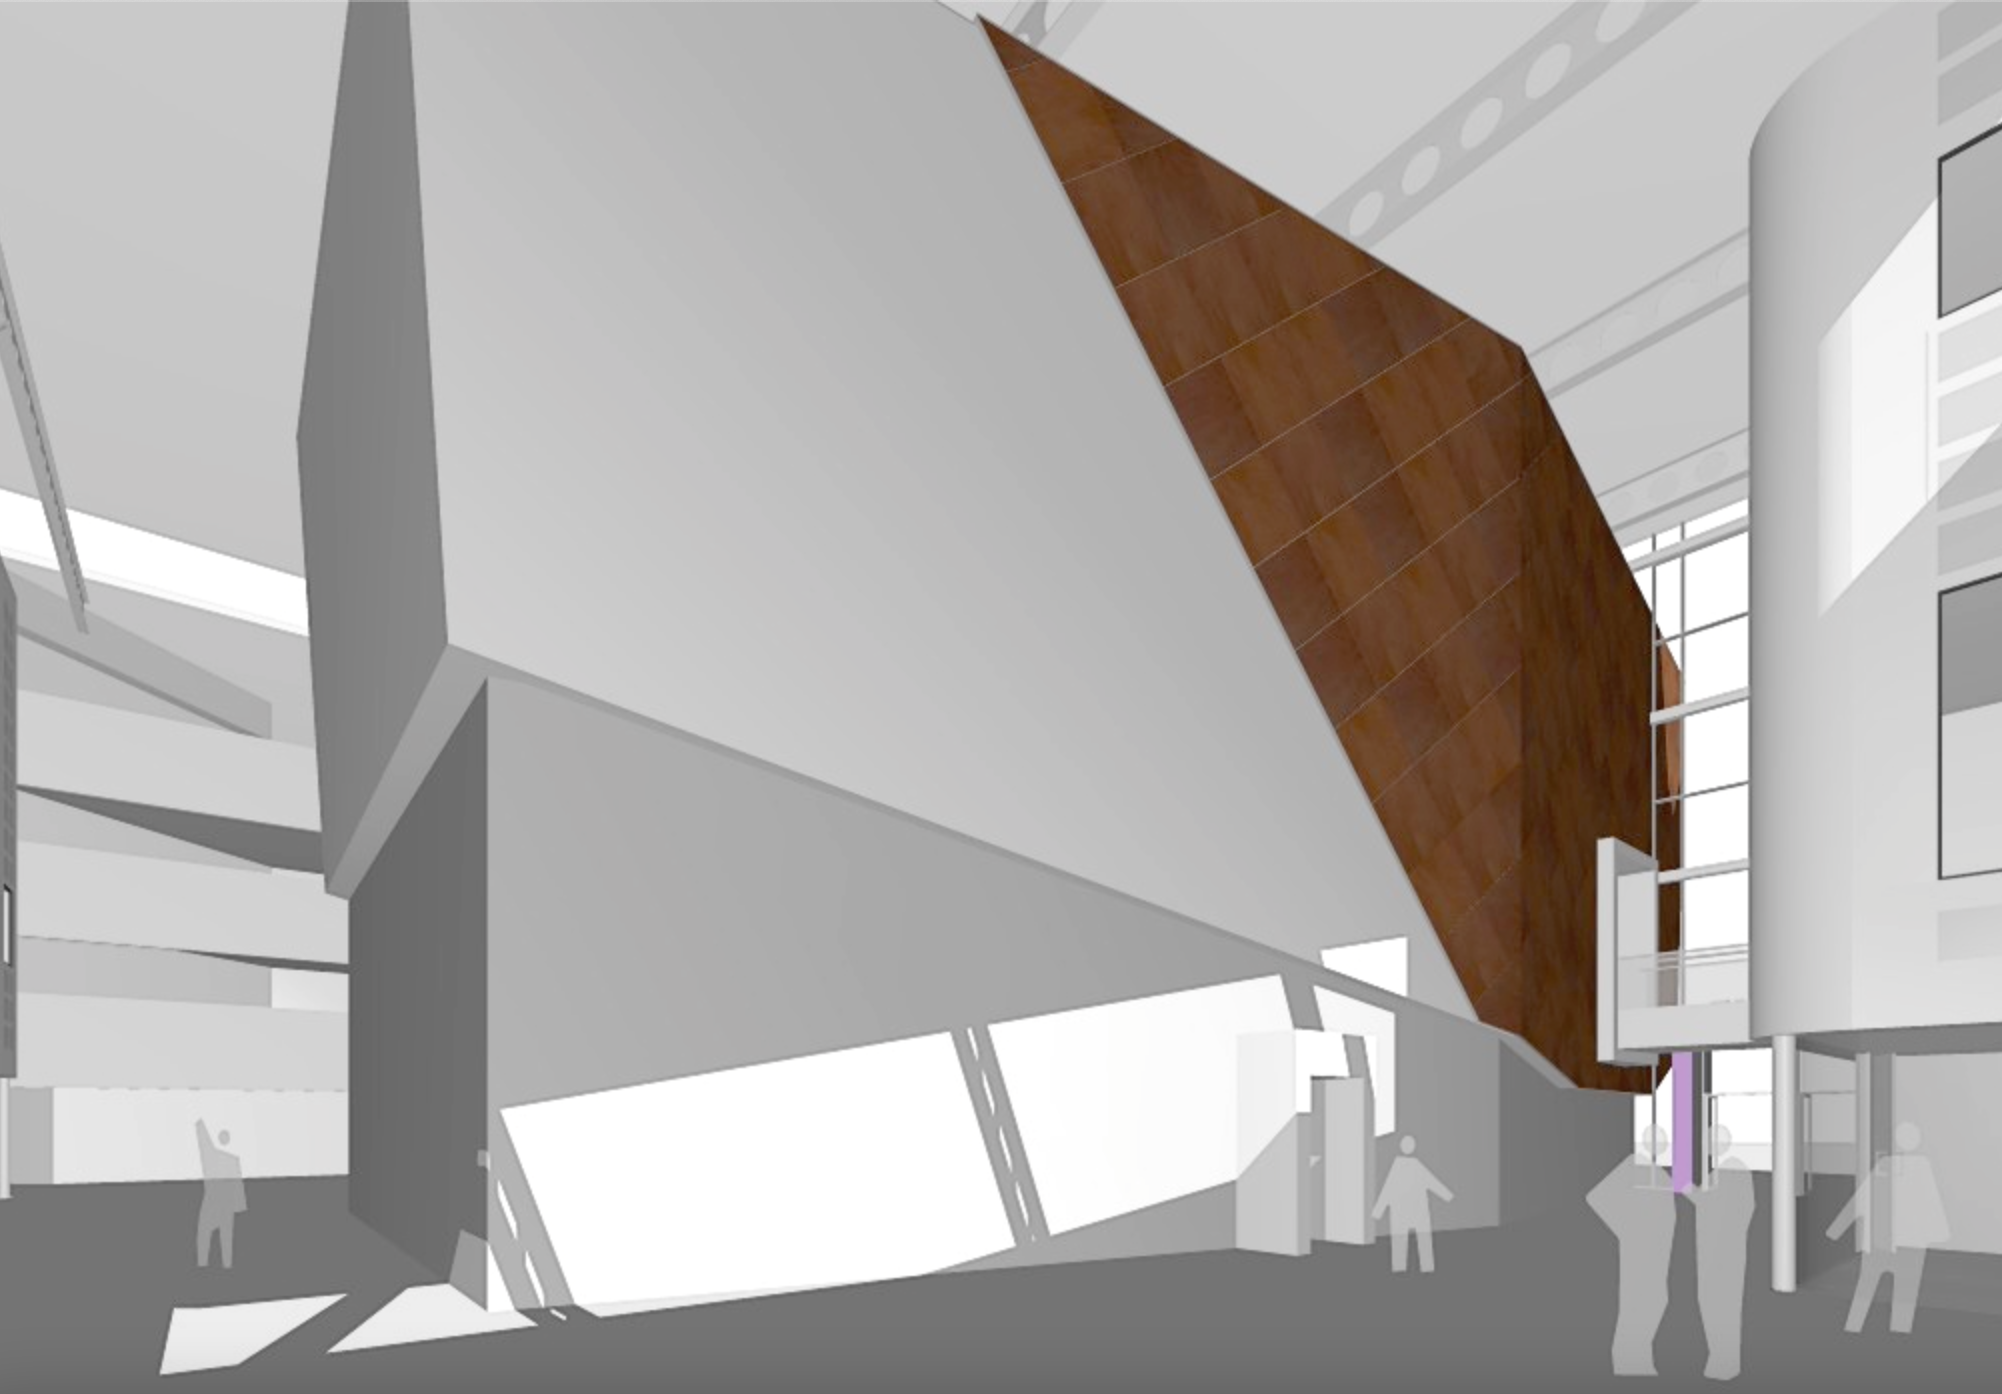
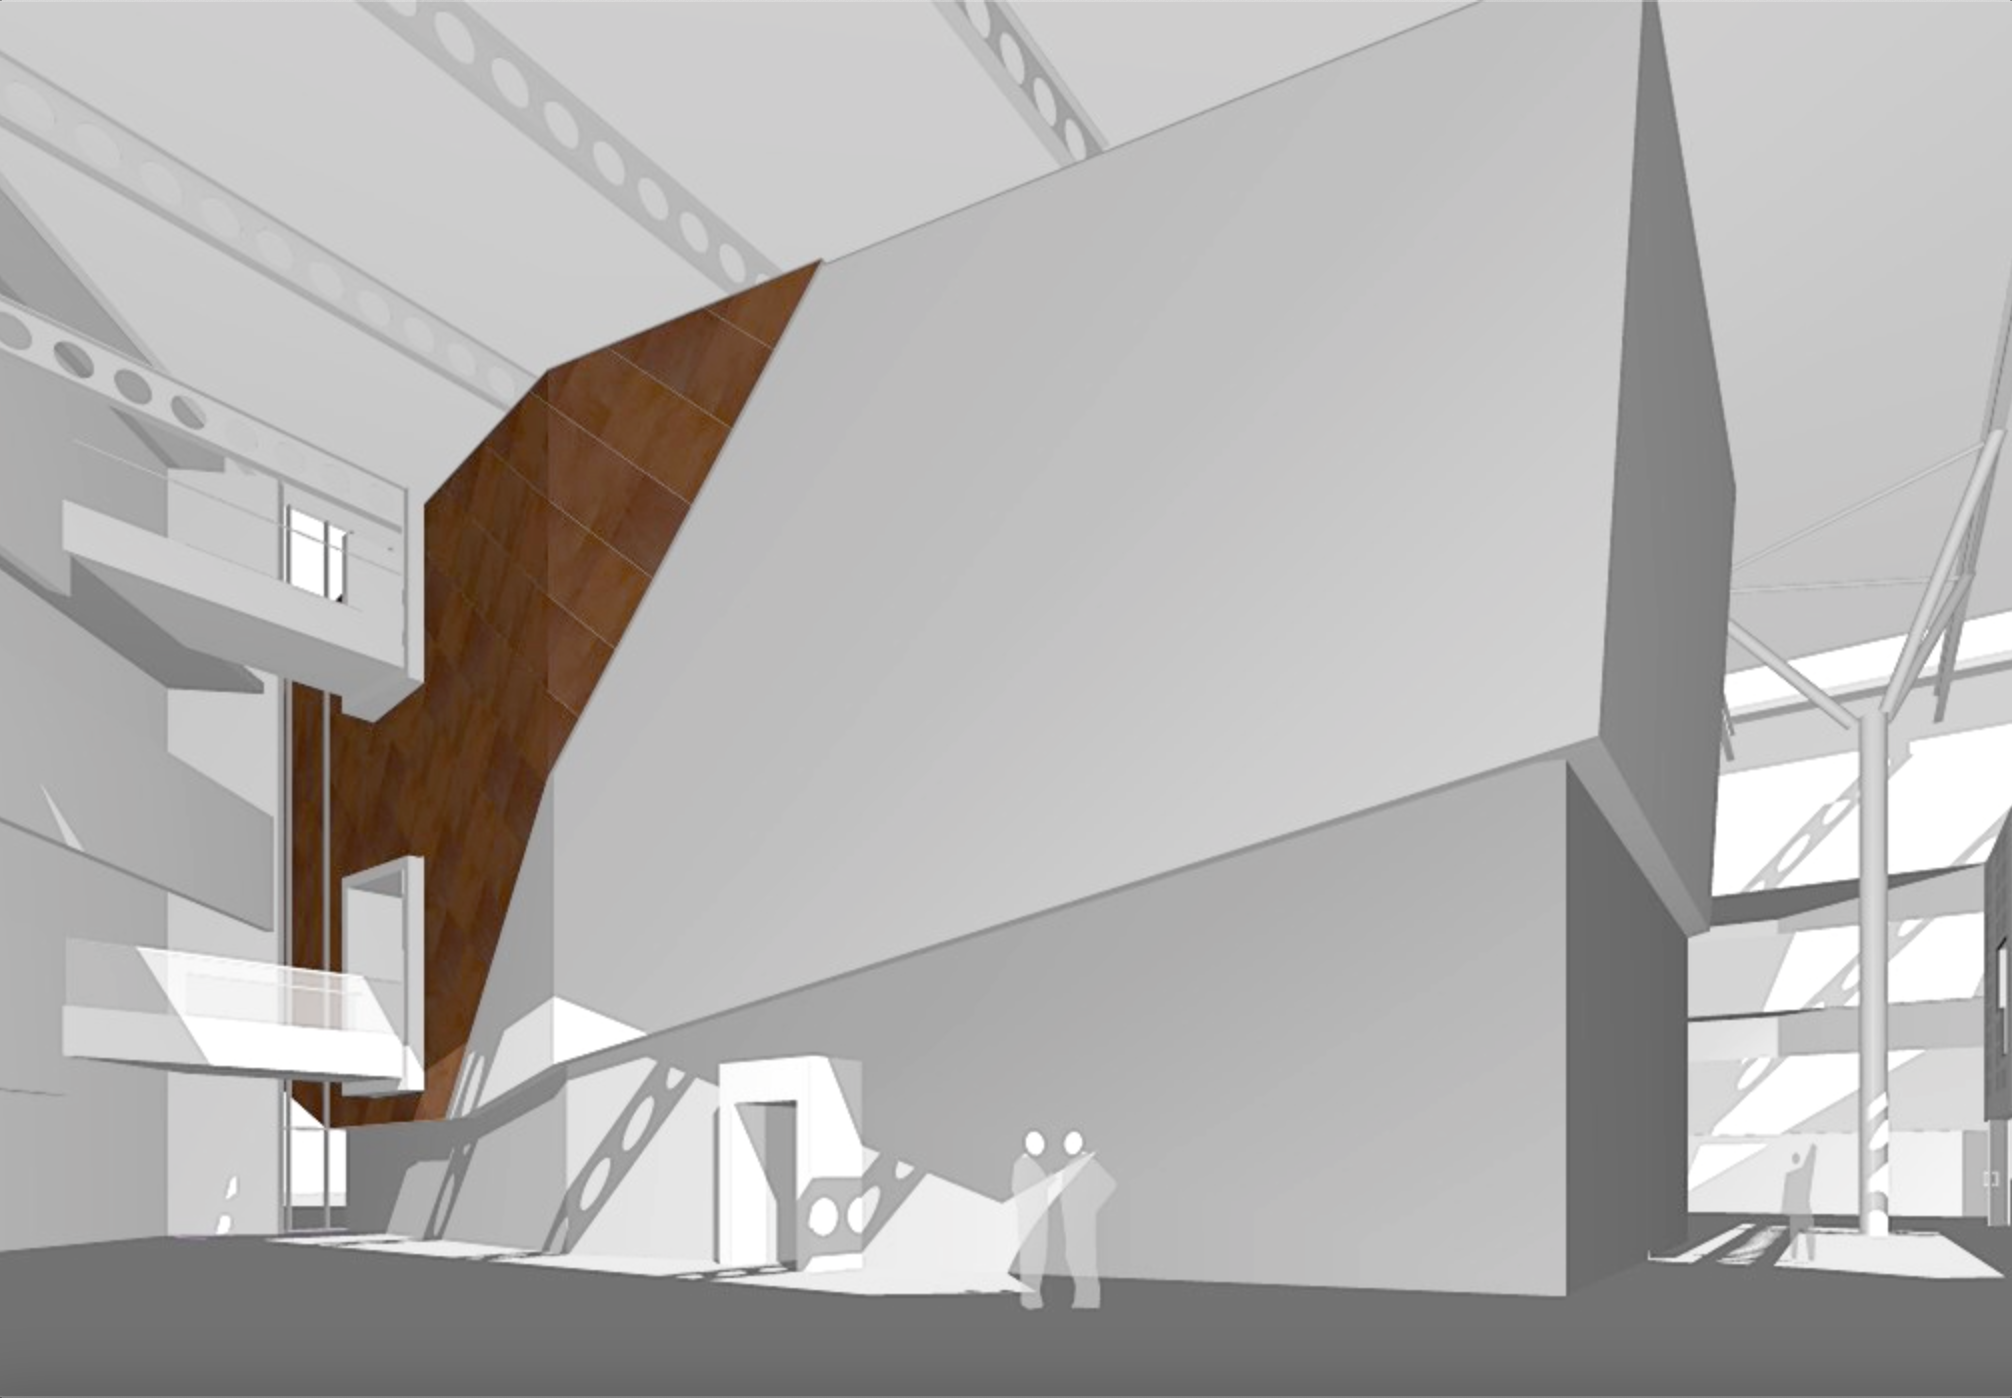
School Entrance Animation [selected stills], BDP.
Diagrams as Inscriptive and Generative
Garcia (2010) argues that among one of the most prominent critiques to the architectural diagram is the lack of exploration of “architecture’s full multidisciplinary potentials, and connections” (p. 33). In architectural writing and design, there seems to be an absence of a sustained theoretical engagement with some closely related spatial disciplines such as geography (Wood, 2013), earth sciences (Arènes, Latour & Gaillardet, 2018), as well as conceptual and ecological art practices (Dàvila, 2019). Fields that have engaged in robust initiatives of spatial diagramming as ways for imagining, visualising and engineering new worlds in connection to global problems, unsustainable growth, colonial erasures, extractivism, climate change and other ongoing crisis. As Lecomte (2020) notes, it is alarming the contrast that prevails between architecture’s powerful means for imagining and visualizing and the general disconnection of these from grappling with actual philosophical, ecological, and existential emergencies.
Precisely, our study aims to think architecture interdisciplinary, across fields like education, design, digital ethnography and digital techniques of mapping and visualisation, with the aim to develop more nuanced ways of inquiring and representing the lived experience in newly designed school buildings whose atmosphere is continuously modulated by sensor technologies in embedded computing systems that ongoingly collect and distribute data. Our motivation is to explore, connect and clash these different fields while drawing from posthumanist methodologies oriented towards affect and eco-sensory relations. Thus, we are interested in diagramming practices that deploy mappings and visualisations of the school building that can help us envision its lived experience from the perspective of processes, actions, sensous bodies, and affective forces.
Considering all this, we appreciate how Dortdivaniloglu (2018) foregrounds the interdisciplinary nature of the architectural diagram, by affirming that current uses of the diagram in architecture show that these are informed by aspects of the diagram in science, as well as aspects of the diagram in philosophy. While the definitions of the diagram in the two fields are somehow dichotomic, Dortdivaniloglu (2018) argues that existing examples in architectural practice demonstrate that they can be thought in a continuum.
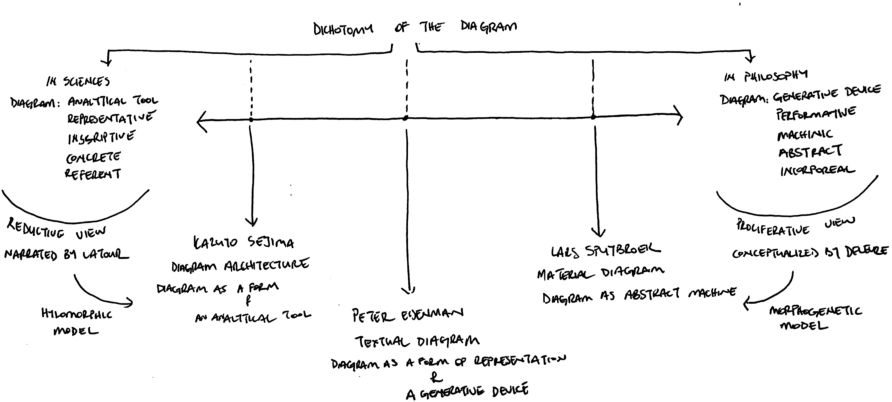
Diagram of dichotomy of the diagram, Dortdivaniloglu, 2018
The sciences “promote the inscriptive aspect of the diagram as a visual tool to render scientific processes or objects onto an abstract representation, which acts as a concrete, irrefutable and referential object” (Dortdivaniloglu 2018, p. 1, emphasis added). Dortdivaniloglu clarifies that this view of the diagram is effectively discussed in the work of Latour (1999), and more precisely in his ethnographies of science where he follows a group of scientists in an expedition to the Amazon Forest, observes them in action, systematically collecting , connecting, mapping data. This eventually leads to the generation of a diagram that conveys a concrete representation of unfolding effects of complex forest dynamics. This diagrammatic practice seeks a concrete, representational, inscriptive ontology to produce situated representations of the real.
In turn, the philosophical approach to the diagram is diverse, and connected to various philosophies, Bergson, Pierce, Foucault, Deleuze and Deleuze and Guattari. However, many coincide that the view of the diagram that has had more influence in architecture is Deleuze’s (see, Garcia, 2010; Dortdivaniloglu, 2018; Lecomte, 2020, Viedler, 2010), who “emphasizes the performative act of the diagram as an abstract machine, which generates genuine creations (Dortdivaniloglu, 2018, p. 1, emphasis added). In this case, the diagram is not a representation but a relation of forces whose ontology is incorporeal, abstract, and virtual. Deleuze and Guatari (2005) write,
…an abstract machine itself is not physical or corporeal, and more than it is semiotic, it is diagrammatic. It operates by matter, not by substance, by function not by form. The diagrammatic or abstract machine does not function to represent, even something real, but rather construct a real that is yet to come, a new type of reality (p. 141).
In such passage, we notice that the Deleuzian diagram works both generatively and inscriptively. It starts at the generative, processual level by operating through the forces of matter, which do not need to be externally initiated because they function virtually and machinically, acting by excess and consequently escaping capture. However, there are some actualizations, emergent forms that enact the inscriptive level of the diagram in which acting forces (the bodies they collapse, the spaces they generate, the affective folds that they create, the bifurcations they produce) can be mapped.
Connections with our Study
Our project has engaged with both the inscriptive and the generative aspects of the diagram. In one instance, we have followed Yaneva’s (2012, 2022) mapping of building’s lives, that traces the architecture of the school as being in the making, an ongoing process enacted by multiple actors (architects, politicians, construction companies, local authorities, families but also materials, technologies, models, codes, skills, expertises), paying attention to how encounters between these different actors deliver controversies. Following Latour’s distinction of matters of fact and matters of concern, Yaneva describes controversies as key processes, underlying dynamics, relations, and connections that are contingent but often not visible and that determine how design is performed in different phases of a building’s life. As Yaneva (2022) writes “mapping is thereby a means of tracing, analysing and visualising the successive stages of controversies, the different statements of the actors, their relations and disagreements, using a variety of representational tools” (p. 39).
Thus, mapping controversies foregrounds the inscriptive aspects of the diagram in the sense that it unearths, systematises, connects and organises broad sources and expressions of narrative data (architectural, technical, media, ethnographic, etc) in a map. At the same time, the process of composing these mappings through the work of coding software like Nvivo and network-mapping software like Cortex foregrounds the generative aspects of mapping, clustering connections in ways that were not foreseeable by simply approaching the data as written texts. The emerging clusters have the potential to reveal how the design moves and has affective force, by visualizing when a concern takes form, speeds up, generates further actions, slows down, dilutes and possibly disappears.
One of the examples, of maps of concerns/controversies created in our project explores the Design and Access Statement produced by BDP in support of the planning application for the new school building. Through the use of the bespoken software, it became possible to identify key concerns driving the design. The map diagrams six clusters which loosely link with Technological Education Facilities, Site Access, External Spaces/Facilities, School Community Interface, Environmental Systems, and Key Design Principles. The mapping traces and makes visible the design tactics used to address these issues and relations between terms.
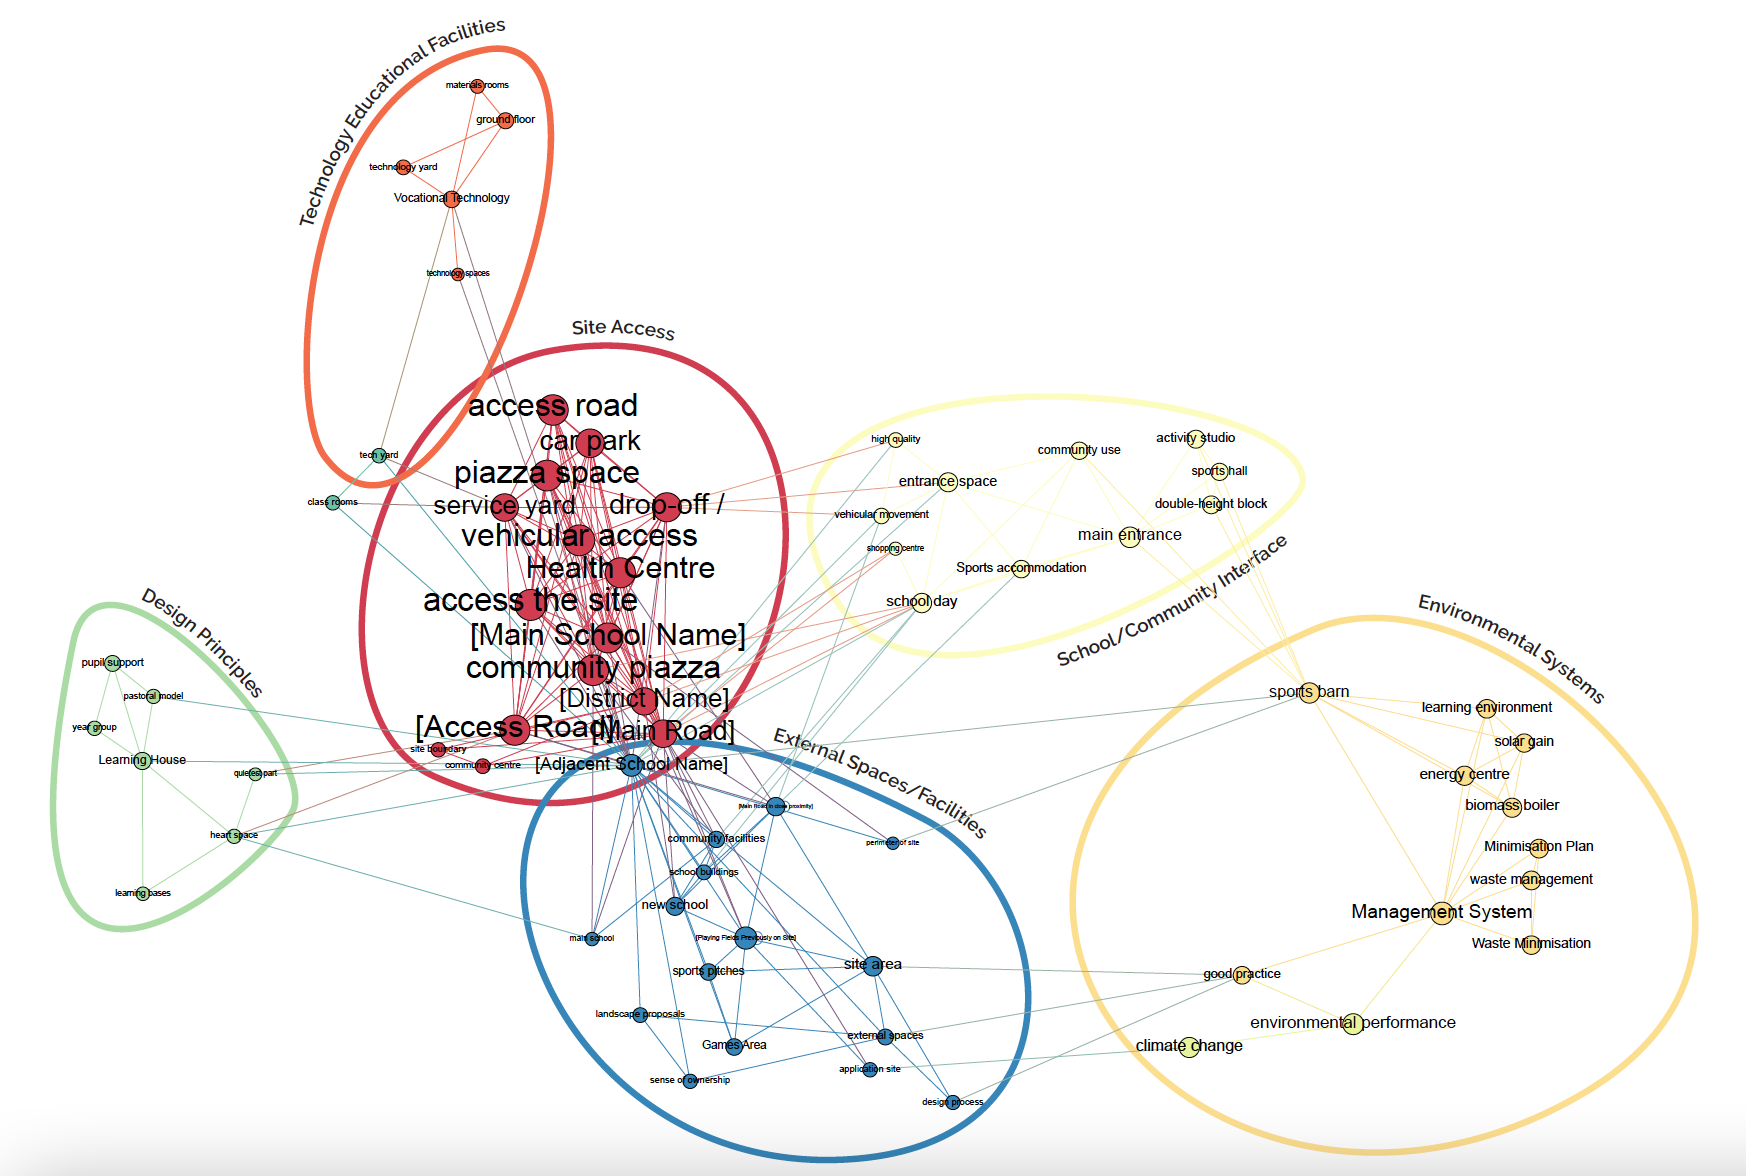
Exploring the school design through mapping controversies, Ben Blackwell, 2022
In another instance, we followed an approach centered in the generation of living maps (Aï-Touati, Arènes & Grégoire, 2022). Living maps are alternative representations to the practices of perspectivism still heralded in much architectural design, which present space as an empty and stable plan. Maps of the living are situated and precarious sketches “of active body-spaces” (p. 55) that direct attention to the action of creatures and organisms dwelling in, moving through, escaping from the school building, and so on. They offer insight on to the sensuous and kinaesthetic aspects of experience, expressed in the mode of trajectories, rhythms, emplacements, speeds and stasis. Different from a blueprint, they visualize the school building as a territory made of landings, points of reference, and bifurcated encounters.
The School Lived Landscapes is a map designed with data drawn from documentations of the building’s life, interviews with teachers and staff, and participative workshops with a group of Year 12s. It connects and folds the data to trace the lived spaces of twelve different creatures, by focusing on small, invisible, taken-for-granted and ephemeral behaviours that foreground encounters, entanglements and attachments to the built environment. The diagramming involved in the process is inscriptive in the sense that it organises concrete movements within recognisable building spaces. It is generative because in the process of layering and connecting these concrete movements the diagram reveals the formation of living landscapes shared between different creatures, giving visual form to daily cycles, where dynamic forces that propel control, escape, refuge, clash, segregation, delay, congregation, and so on appear, disappear, and repeat.

The school lived landscapes map, L. Trafí-Prats, 2022
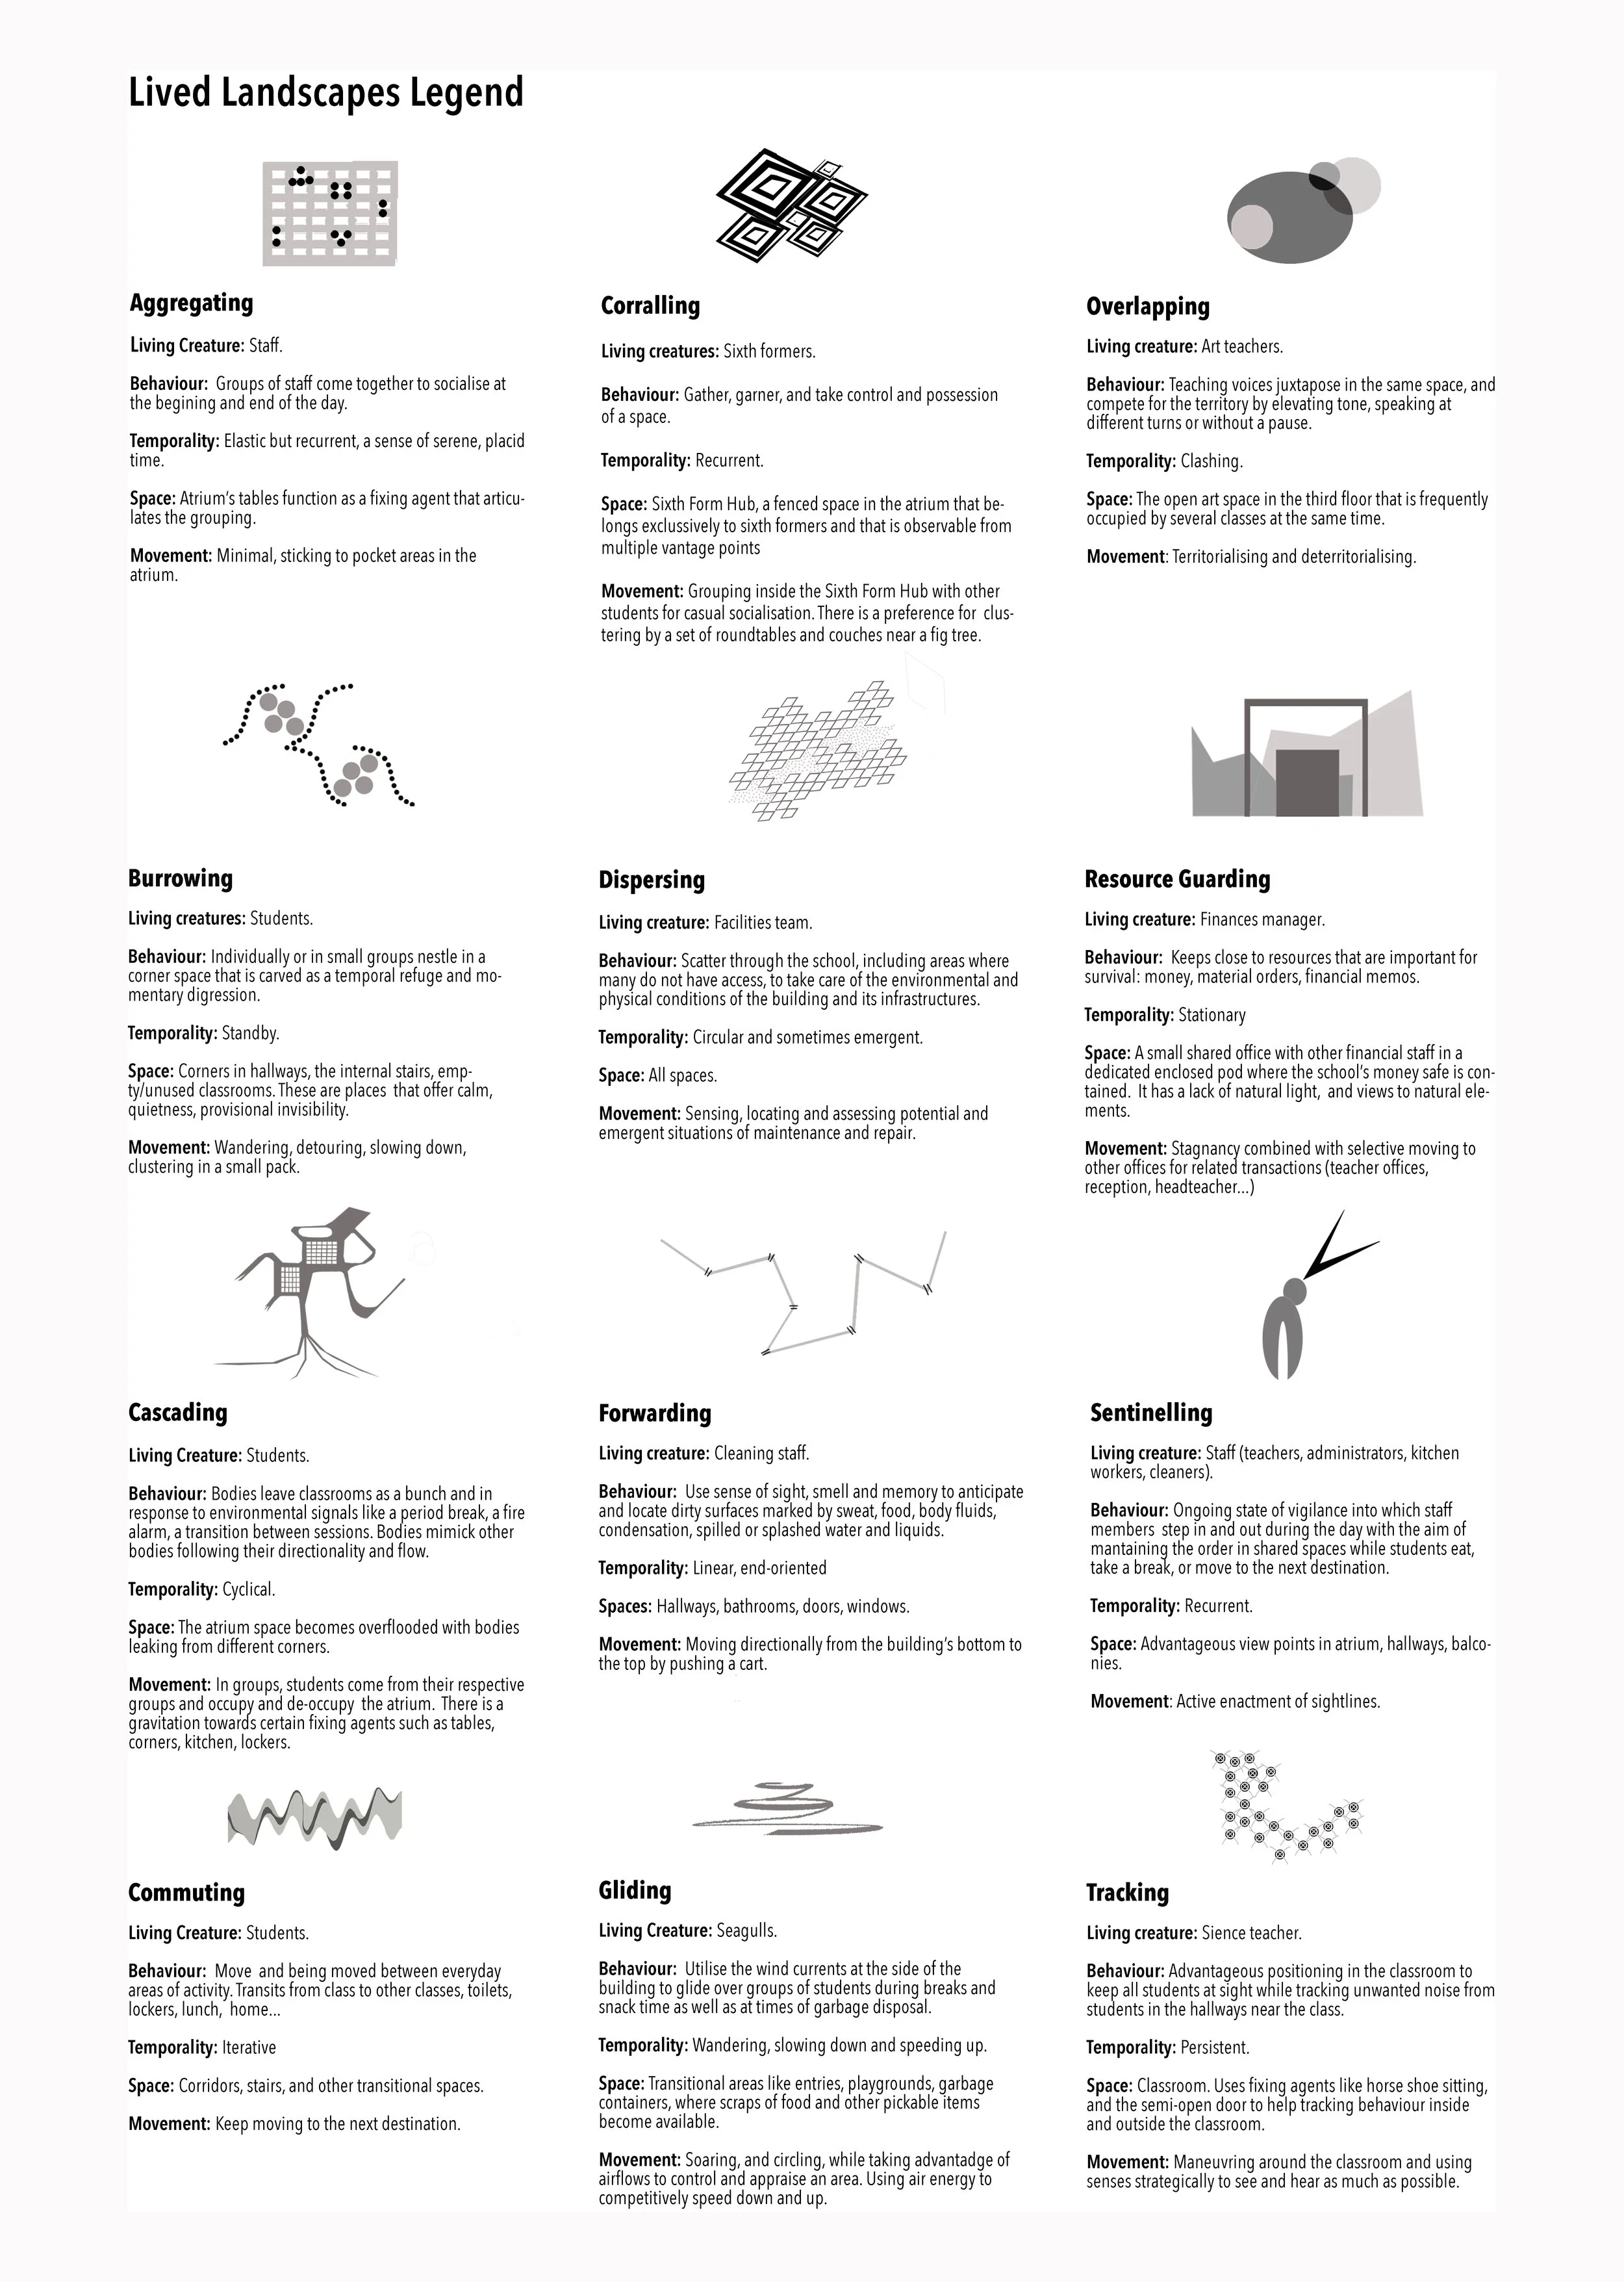
School lived landscapes legend, Trafí-Prats, 2022
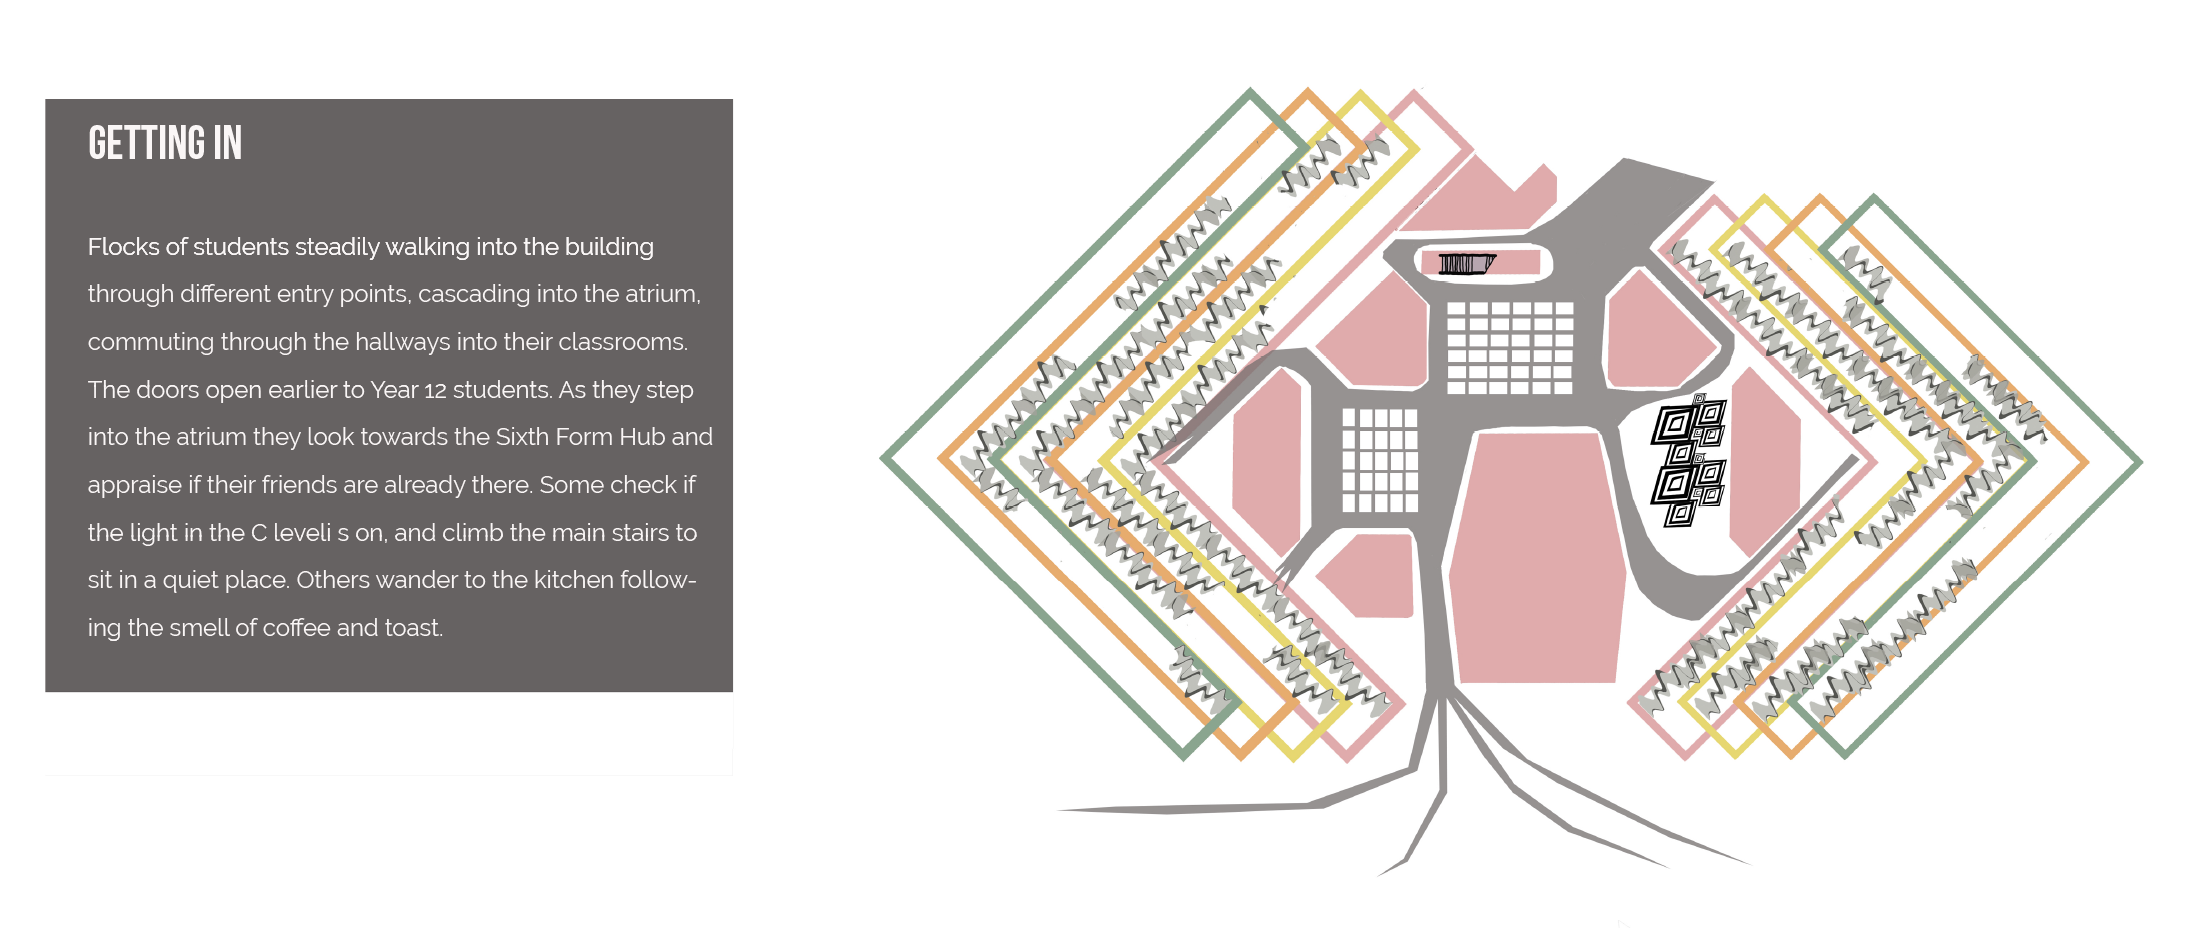
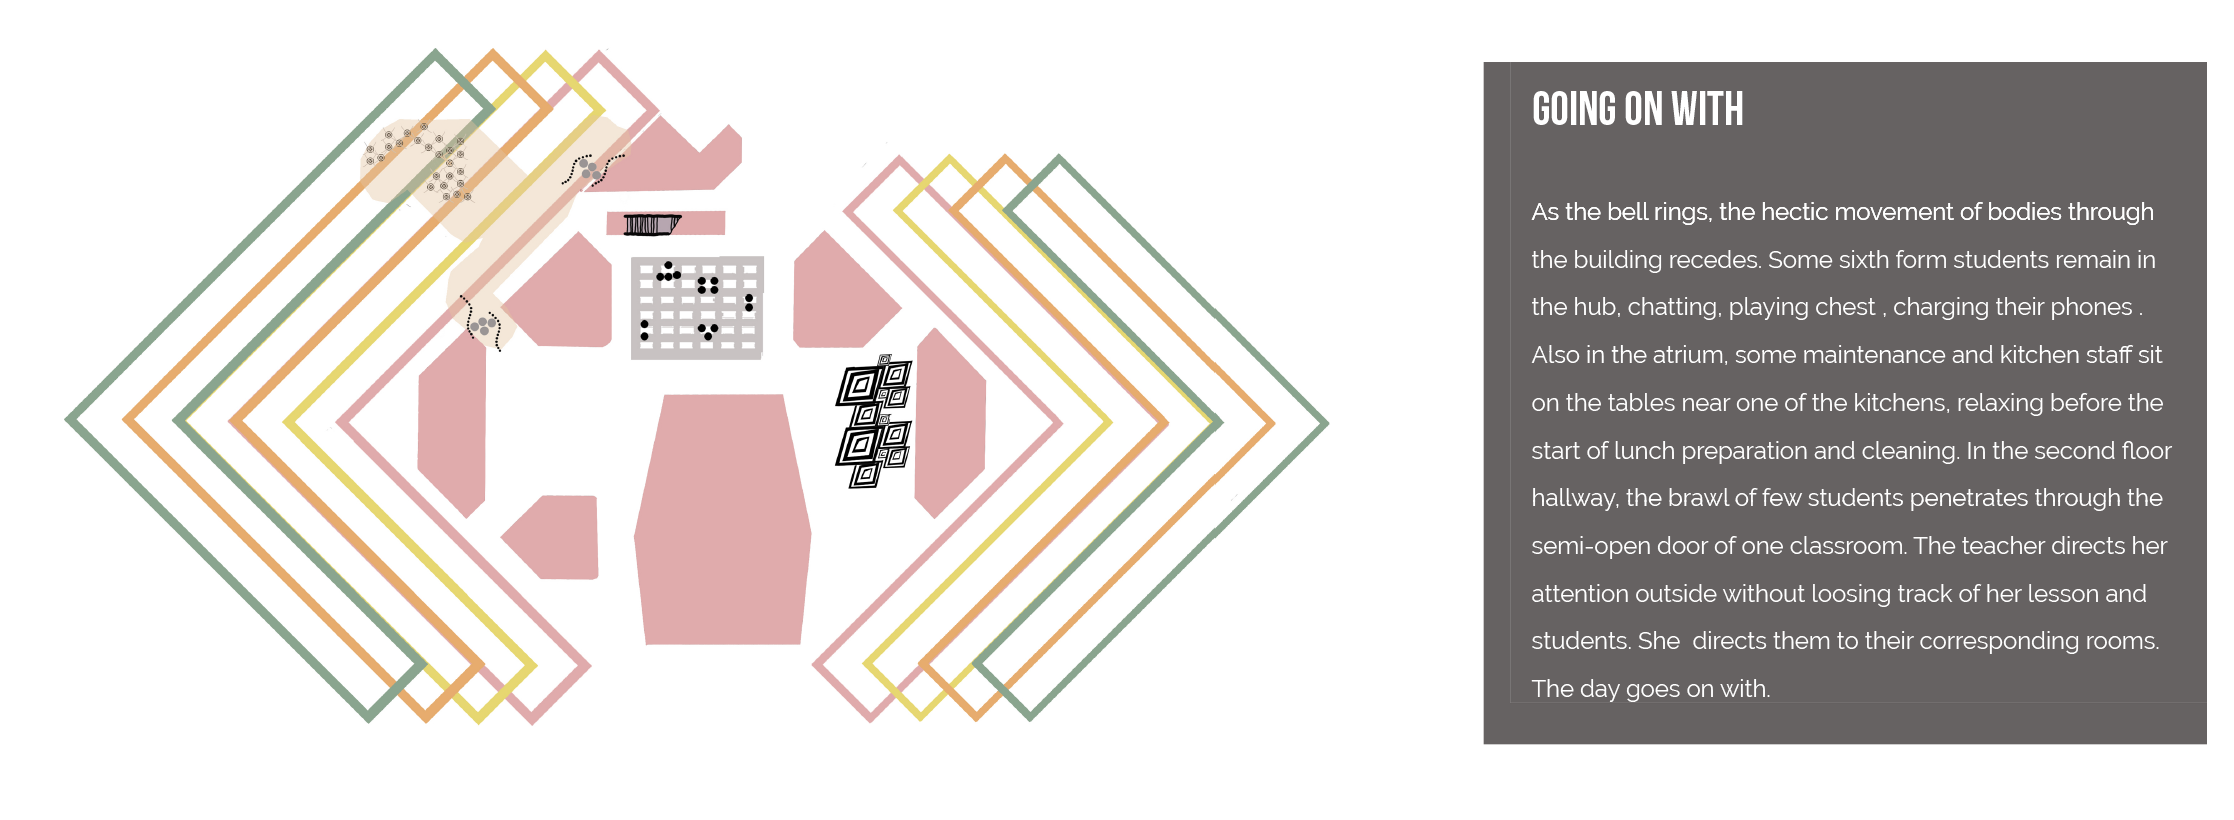
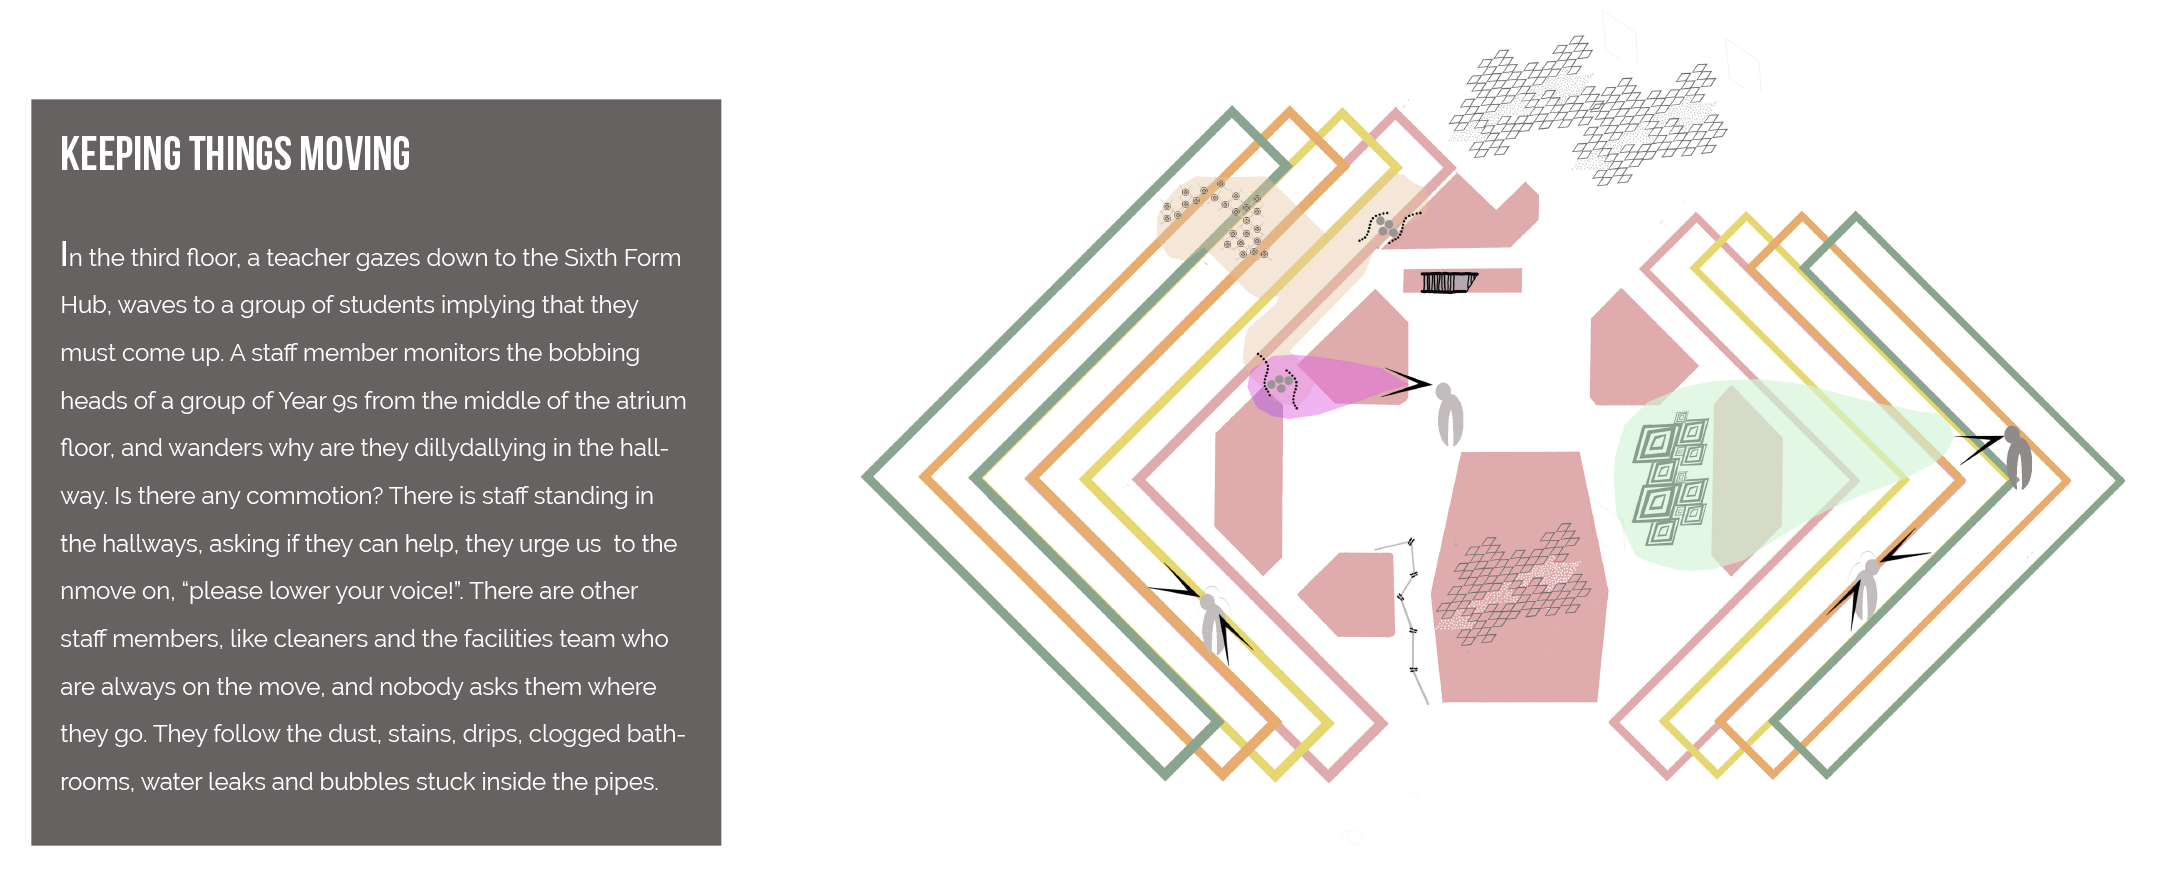
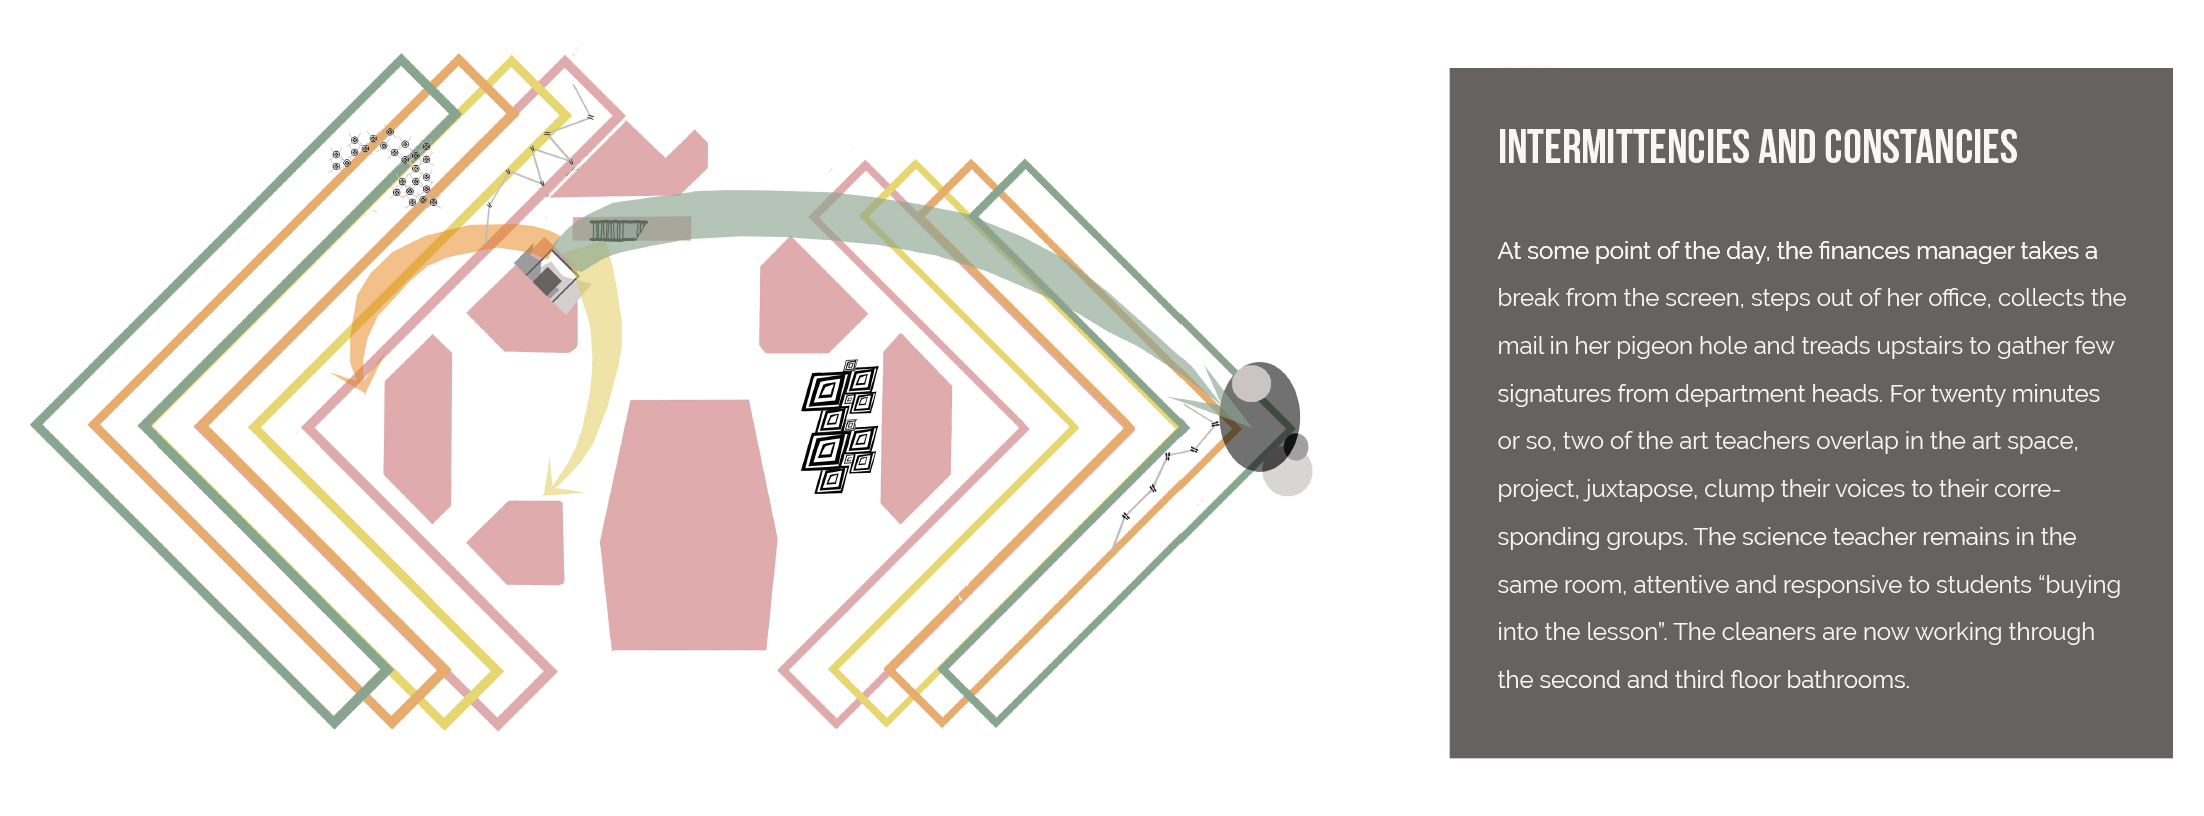
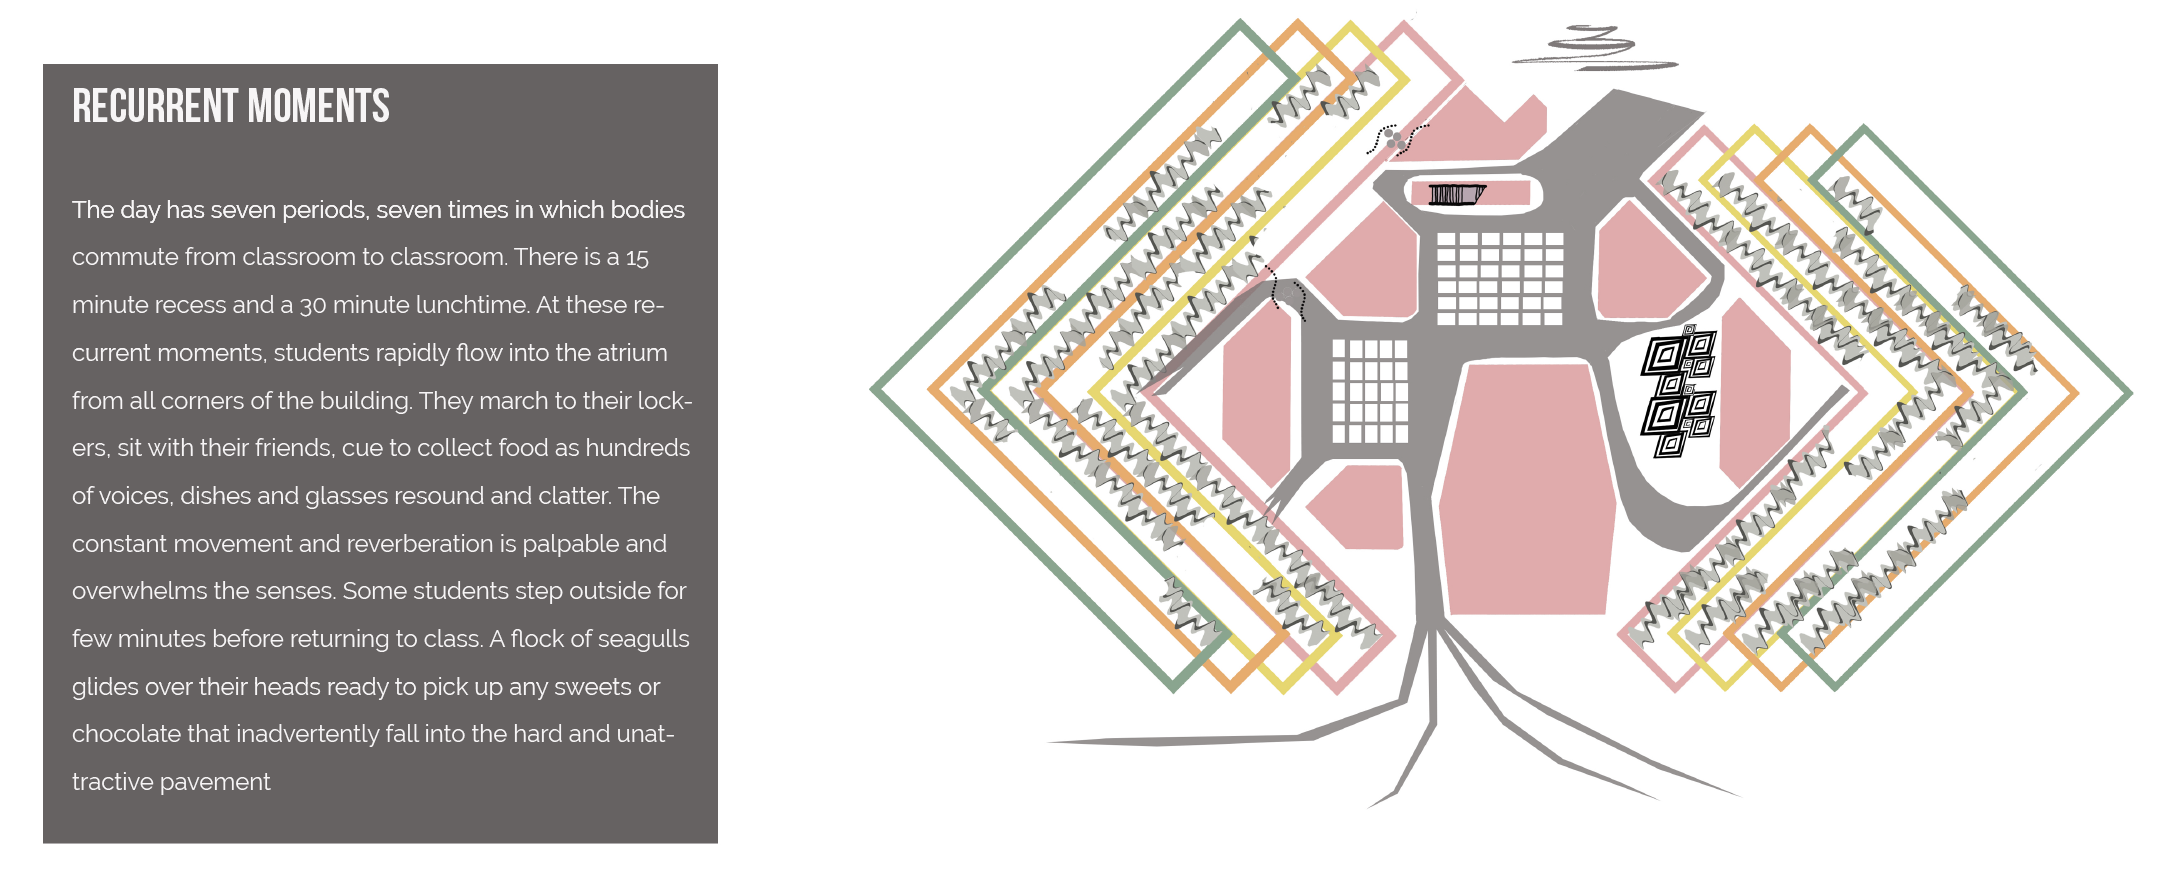
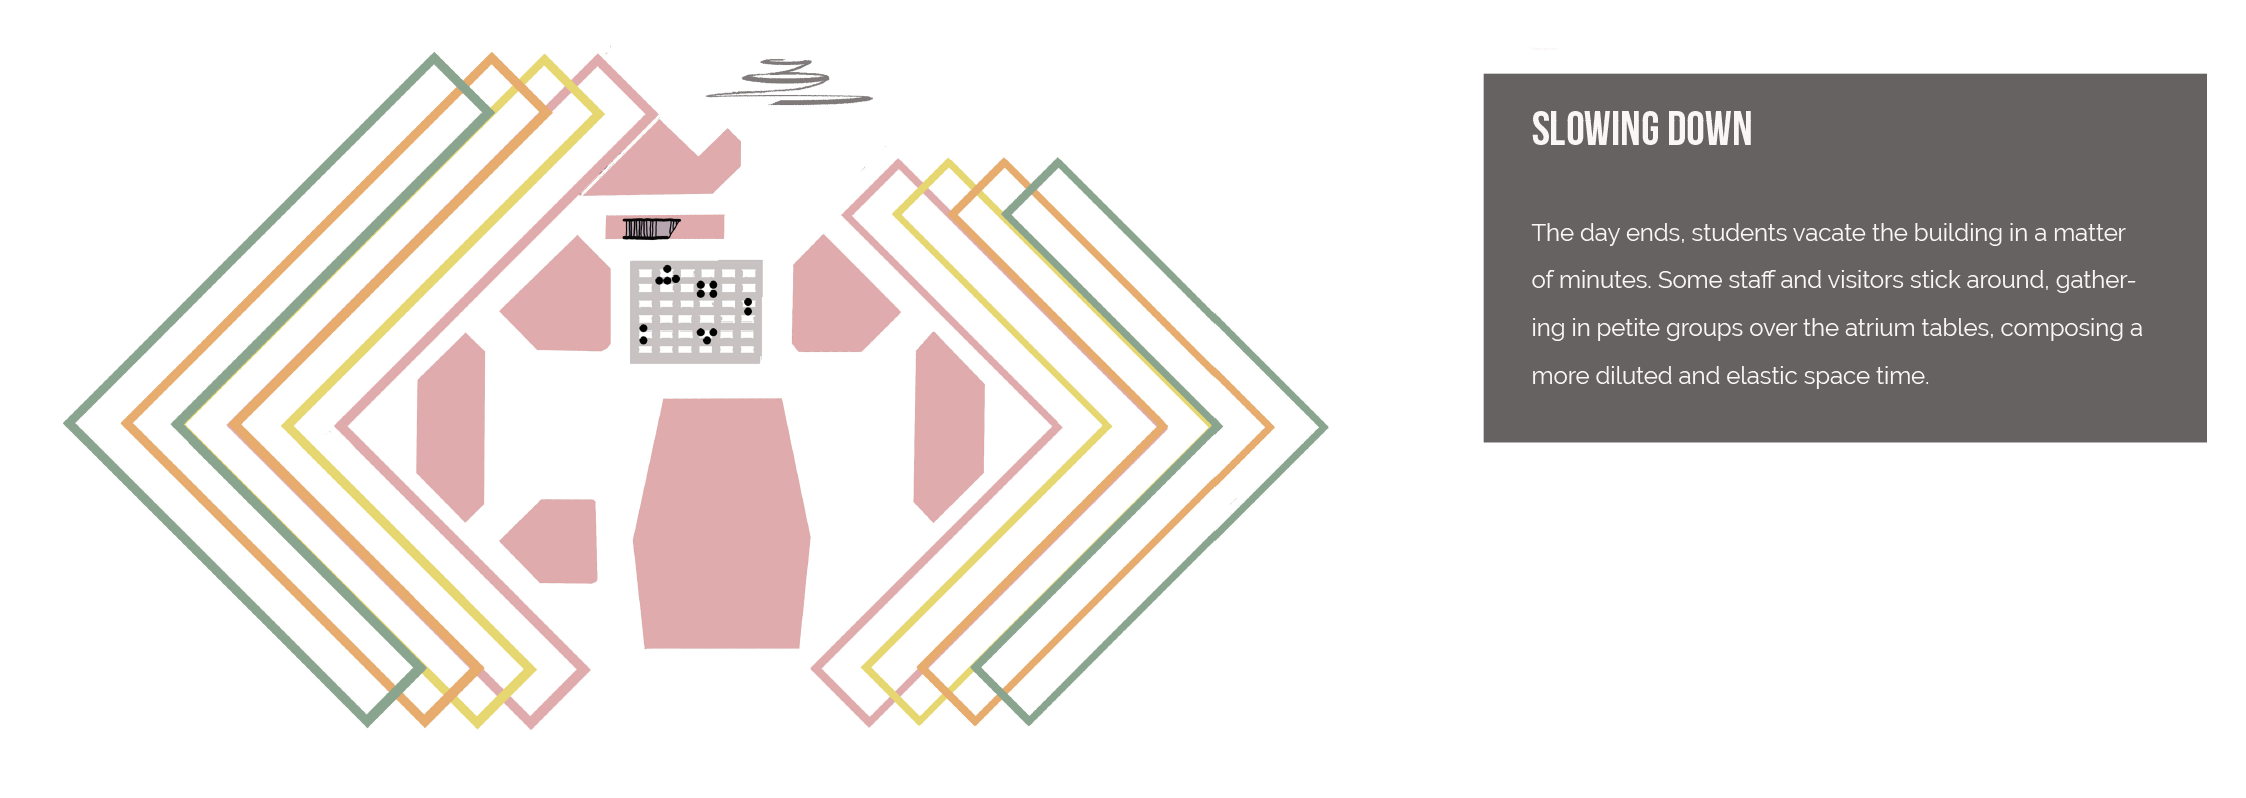
Layering of school lived landscapes across the day cycle, L. Trafí-Prats, 2022
References
Aït-Touati, F., Arènes, A., Grégoire, A. (2022). Terra Forma: A book of speculative maps. (Trans. Amanda DeMarco). MIT Press.
Arènes, A., Latour, B. & Gaillardet, J. (2018). Giving depth to the surface: An exercise in the Gaia-graphy of critical zones. The Anthropocene Review, 5 (2), 120-135.
Aureli, P. V. (2005, Fall). After diagrams. Log, 6, 5-9.
Clark, R. H. & Pause, M. (2005). Precedents in architecture: analytic diagrams, formative ideas and partis. Wiley.
Dàvila, P. (2019). Diagrams of power. Visualizing, mapping and performing resistance. Onomatopee and Public Visualization Lab.
Deleuze, G. & Guattari, F. (2005). A Thousand Plateaus: Capitalism and schizophrenia. University of Minnesota Press.
Dortdivaniloglu, H. (2018, Sept). The diagram in continuum: From inscription to generation of form in architecture. [Conference Paper] ARCC Conference Repository.
Drucker, J. (2021). Visualization. In N. B. Thylstrup, D. Agostinho, A. Ring, C. D’Ignazio & K. Veel (Eds.), Uncertain archives: Critical keywords for big data, (pp. 561-568). MIT Press.
Ferrater, B. & OAB (2006). Synchronising geometry: Landscape architecture and construction/ideographic resources. Actar.
Garcia, M. (2010). Histories and theories of the diagrams of architecture. In M. Garcia (Ed.), The diagrams of architecture (pp. 18-45). John Wiley & Sons.
Latour, B. (1999). Circulating reference. In Pandora’s Hope (pp. 24-70). Harvard University Press.
Latour, B. (2008). “A Cautious Prometheus? A Few Steps Toward a Philosophy of Design (with Special Attention to Peter Sloterdijk)”. Keynote lecture for the Networks of Design Meeting of the Design History Society, Falmouth, Cornwall, 3rd September, 2008.
Lecomte, J. (2020). Can the possible exist in physical form? On architectural projectiles, computation and worldbuilding. In A. Beech & R. Mackay (Eds.) Construction site for possible worlds (pp. 145-170). MIT Press.
Lefebvre, H. (1991). The production of space. Blackwell.
Power, M. (2003). Schools for the future: Inner city secondary education exemplar. Arq, 7 (3/4), 263-279.
Viedler, A. (2010). Diagrams of diagrams: Architectural abstraction and modern representation. In M. Garcia (Ed.), The diagrams of architecture (pp. 54-63). John Wiley & Sons.
Wood, D. (2013). Everything sings: Maps for a narrative atlas (Second Edition). Siglio.
Yaneva, A. (2012). Mapping controversies in architecture. Routledge.
Yaneva, A. (2022). Latour for architects. Routledge.